




Quick answer: The median published penetration testing day rate in this index is £1,000 (US$1,364), measured across 30 public-sector rate cards live on the UK Government's G-Cloud 14 framework. The central band runs £800 to £1,200 (US$1,092 to US$1,637) and the full published spread runs £480 to £1,600 (US$655 to US$2,183). Converted to whole engagements at that index median rate and at published day counts, a single web application test derives to roughly £3,000 to £12,000, an external network test to £3,000 to £5,000, a cloud review to £4,000 to £5,000, and a focused red team exercise to £10,000 to £15,000 (£14,000 to £21,000 at the higher day rate red team work actually carries). Vendors who publish fixed fees rather than day rates quote a web application test at £3,750 to £6,250+ and £8,000 to £18,000 depending on scope. Subscription and per-test list prices start at US$95 per month for scanning tooling, US$650 per month for a continuous autonomous pentest of one web application and its APIs, and US$1,999 per year for an entry PTaaS plan.
What this index is, and what it is not
This page is a price index. It records prices that vendors and suppliers have actually published, on their own pages or on a public procurement framework, with a link to each one. It does not estimate, model, or average anything that was not published somewhere a reader can go and check.
That makes it a different document from a cost guide. Stingrai's penetration testing cost guide for 2026 explains the drivers: why an authenticated multi-role application costs more than a brochure site, how host counts move a network quote, what compliance evidence adds. Read that first if the question is "why does this cost what it costs". Read this page if the question is "what is the market actually charging, and can I see the receipts". If the question is "what would my specific scope cost", the pentest cost calculator turns a scope into a point estimate in about two minutes, and Stingrai's own published pricing is one of the rows in the tables below.
Three things this index deliberately excludes. It excludes quoted-on-request pricing, which covers most of the enterprise market. It excludes market estimates published in vendor cost guides, because an estimate of what others charge is not a price. And it excludes any figure that could not be re-read on the source page during the verification pass, with no exceptions made for numbers that looked plausible.
Index readings at a glance
Median published day rate (2026): £1,000, about US$1,364 (G-Cloud 14 rate cards, n = 30).
Central day-rate band (2026): £800 to £1,200, about US$1,092 to US$1,637 (median floor to median ceiling across the same 30 listings).
Full published day-rate spread (2026): £480 to £1,600, about US$655 to US$2,183, low end Zoonou, high end Dionach and Bridewell.
Most expensive engagement type by day rate (2026): red team and adversary simulation, median £1,400 (US$1,910), n = 3.
Cheapest specialist engagement type by day rate (2026): web and application testing, median £950 (US$1,296), n = 4.
Lowest published per-test price for a human-delivered web application pentest (2026): US$3,500 per test for platform subscribers, US$4,000 one-off (Intruder).
Lowest published price for an autonomous web application pentest (2026): US$3,000 one-time (Stingrai), against a promotional US$3,500 per test (Cobalt).
Lowest published annual PTaaS list price (2026): US$1,999 per year for one target (Astra Security).
Lowest published continuous-testing list price (2026): US$650 per month on a 12-month engagement covering one web application and its APIs (Stingrai).
Published fixed-fee range for a focused red team exercise (2026): £15,000 to £35,000 (EJN Labs) and £15,000 to £50,000+ (Precursor Security).
Key takeaways
The day rate is far more stable than the engagement price. Published day rates cluster tightly: half of all listings sit between £800 and £1,200, and the whole market fits inside £480 to £1,600. Published engagement prices for the same work span a factor of five. The variance buyers experience is almost entirely a variance in scoped days, not in the price of a tester's time.
Red team work commands a real premium, and it is smaller than most buyers expect. The red team median day rate of £1,400 is 40% above the overall median of £1,000, not the two or three times premium that enterprise quotes often imply. What makes red team engagements expensive is duration: published day counts run 10 to 15 days against 3 to 5 for a network test.
Cloud testing now prices above network testing. Cloud engagements carry a median day rate of £1,250 against £1,000 for network infrastructure. Five years ago cloud was priced as a configuration review; the published rate cards now price it as specialist work.
Publishing a price is itself a minority behaviour. Six AWS Marketplace penetration testing listings were sampled for this index, from four sellers. One seller publishes a starting price across its three listings; the other three sellers state only that pricing depends on requirements. HackerOne's pentest product page publishes no price at all, and Cobalt publishes a credit definition (one credit equals eight hours of testing) without publishing what a credit costs. Any index of this market is necessarily an index of the transparent minority.
Automation has created a new price floor, not a new price level. Per-test list prices for AI-assisted web application testing now cluster at US$3,000 to US$4,000, and continuous coverage of one application starts at US$650 per month. These sit below, and do not replace, the £1,000 per day human engagement market, and the published scopes are narrower.
Methodology
The index holds 77 published price points and draws on four kinds of source, in descending order of how much weight it carries.
Public procurement rate cards. Thirty penetration testing services live on the UK Government Digital Marketplace under the G-Cloud 14 framework. Each listing carries a supplier-declared price in the form "GBP X to GBP Y a unit a day". These are the strongest evidence in the index because the supplier has published the rate to a government buyer under framework terms, not to a marketing page. Each of the 30 listings was fetched individually and returned HTTP 200 during the verification pass.
Vendor list prices. Prices published on a vendor's own pricing page, in a currency, attached to a defined unit. Twenty-two such price points across six vendors are included.
Published fixed-fee price tables. Two vendors publish complete per-engagement price tables with day counts attached. Nineteen price points are included from those two tables.
Published day-rate benchmarks. Six figures where a firm states what it believes the market rate to be rather than what it charges. These are reported separately and never mixed into the observed-price aggregates.
Inclusion and exclusion rules. A figure is included only if it was read directly from the source page during the pass that closed on 29 August 2026, in the currency the source used, attached to a stated unit. Search-result summaries were never accepted as evidence: in one case a summary reported US$6,000 for a marketplace listing that actually publishes US$4,999, and the listing won. Rate-card entries below £300 a day are excluded from every table and every aggregate, because that field is self-declared and a value that low reads as an hourly or placeholder figure rather than a consultant day rate. One listing publishes a floor of £0, which is excluded from floor statistics as the same artifact while its ceiling is retained. Thirteen candidate figures or sources were dropped during verification, including US federal schedule rates, which are named below rather than quietly omitted.
How the aggregates are computed. Each rate-card listing contributes a floor and a ceiling; single-value listings contribute the same number twice. The midpoint is the mean of the two. The headline figure is the median of the 30 midpoints. The central band is the median floor to the median ceiling. Every step is reproducible from the per-listing tables below, which print each supplier's price verbatim.
Currency. All conversions use US$1.3644 per GBP, the Federal Reserve H.10 observation dated 21 August 2026. USD figures are rounded to the nearest dollar and never printed without the original GBP figure alongside them.
Derived figures are labelled. Where this index converts a day rate into a whole-engagement price, it multiplies the median day rate by a day count that a named source published for that engagement type. Those numbers are derivations, marked as such, and are not observations of a transacted price.
What was dropped. US General Services Administration awarded labour rates: both public CALC endpoints returned HTTP 404 during the pass, and the three GSA schedule price lists retrieved as PDFs contained no penetration testing labour-category rate rows. Vumetric's pricing page returned HTTP 404 and the firm's own FAQ states it publishes no price range. Exploitr's pricing page returned HTTP 403. BreachLock, Sprocket Security, and HackerOne publish no numbers on their pricing pages. Two UK cost guides were excluded because they publish estimates of what the market charges rather than the firm's own prices. None of these gaps were filled with an estimate.
The day-rate index
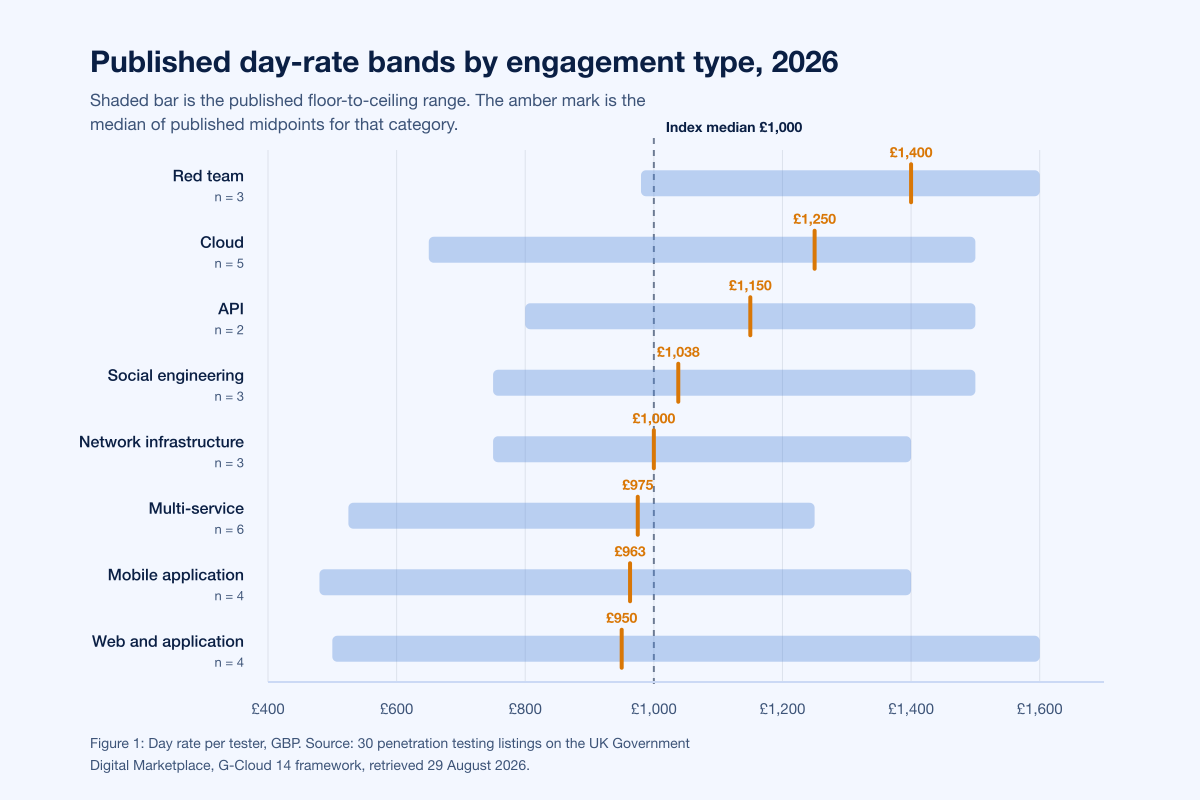
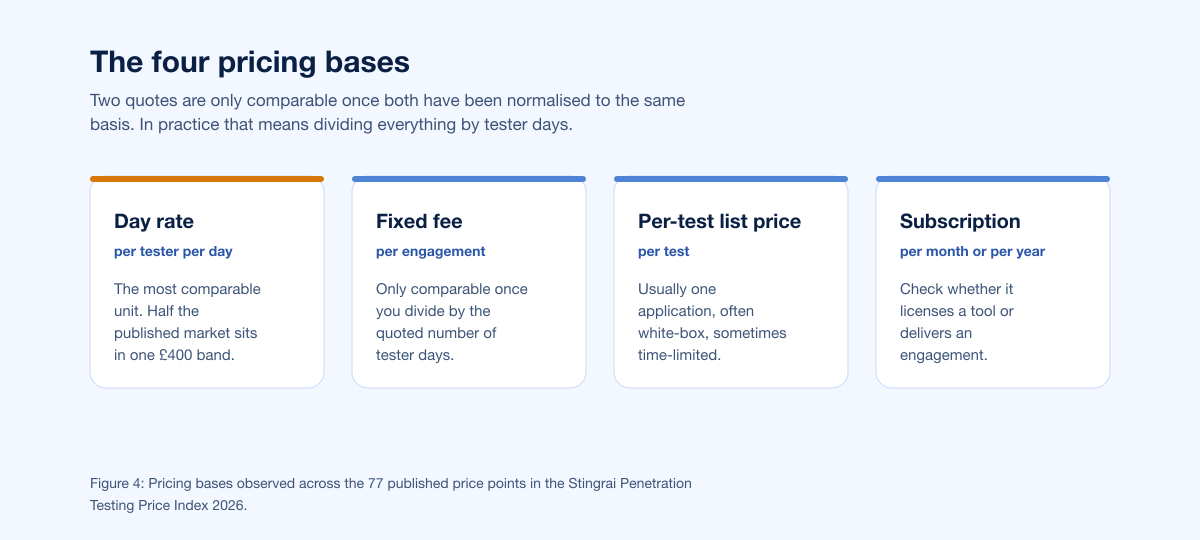
Half of the published market sits in a £400 wide band. That is the single most useful fact in this document, because it means a day rate is a poor differentiator between vendors and a good sanity check on a quote.
Statistic | GBP | USD at 1.3644 |
|---|---|---|
Lowest published floor | £480 | US$655 |
Median floor | £800 | US$1,092 |
Median midpoint (index headline) | £1,000 | US$1,364 |
Median ceiling | £1,200 | US$1,637 |
Highest published ceiling | £1,600 | US$2,183 |
Source: 30 G-Cloud 14 penetration testing listings, UK Government Digital Marketplace, retrieved 29 August 2026.
By engagement type, with sample size shown because two of the categories are thin:
Engagement type | Listings | Published floor to ceiling | Median day rate | Median in USD |
|---|---|---|---|---|
API | 2 | £800 to £1,500 | £1,150 | US$1,569 |
Cloud | 5 | £650 to £1,500 | £1,250 | US$1,706 |
Mobile application | 4 | £480 to £1,400 | £963 | US$1,313 |
Multi-service (unsplit) | 6 | £525 to £1,250 | £975 | US$1,330 |
Network infrastructure | 3 | £750 to £1,400 | £1,000 | US$1,364 |
Red team and adversary simulation | 3 | £980 to £1,600 | £1,400 | US$1,910 |
Social engineering and phishing | 3 | £750 to £1,500 | £1,038 | US$1,416 |
Web and application | 4 | £500 to £1,600 | £950 | US$1,296 |
Rows are ordered alphabetically by engagement type, not by price. The API category carries only two listings and should be read as indicative rather than as a stable median.
Index by engagement type
Every table below lists suppliers in alphabetical order. Nothing in this document is a ranking, a shortlist, or a recommendation, and position in a table carries no meaning. Prices are transcribed exactly as the supplier published them, including the "a unit a day" and "a user a day" phrasings that the framework's own price field produces.
Web and application testing
Supplier | Published price | Unit | Basis |
|---|---|---|---|
Axis Pentest | £850 to £850 | a unit a day | |
Bridewell Consulting | £500 to £1,600 | a unit a day | |
DigitalXRAID | £800 to £1,150 | a unit a day | |
Salus Digital Security | £650 to £1,200 | a user a day |
Published day counts for a single web application run 3 to 5 days (Precursor Security) and 6 to 12 days (EJN Labs), the difference being scope depth rather than disagreement. At the index median of £1,000 a day, that derives to £3,000 to £12,000 (US$4,093 to US$16,373) for the engagement. Published fixed fees for the same work land inside that band at the low end and above it at the high end: £3,750 to £6,250+ and £8,000 to £18,000 respectively.
API testing
Supplier | Published price | Unit | Basis |
|---|---|---|---|
PureCyber | £800 to £1,500 | a unit a day | |
Sencode | £0 to £1,050 | a unit a day |
The £0 floor is a listing-form artifact, not an offer of free work, and is excluded from the aggregates. Published day counts for API testing run 4 to 9 days, deriving to £4,000 to £9,000 (US$5,458 to US$12,280) at the index median. Published fixed fees run £7,000 to £12,000, and one marketplace listing publishes a US$4,999 starting price for API testing.
A pricing-unit note that matters more than the number: several vendors treat an application and its associated APIs as one billable target rather than two. Astra states that "if you have a SaaS app, the entire app with all its APIs and underlying cloud is 1 target", and Stingrai's published plans likewise cover "one web application and its APIs". Two quotes that look 40% apart can be identical once the unit is normalised.
Mobile application testing
Supplier | Published price | Unit | Basis |
|---|---|---|---|
PureCyber | £750 to £1,400 | a unit a day | |
Razor Thorn Security | £850 to £1,150 | a unit a day | |
SecureTeam | £850.00 to £1,000.00 | a transaction a day | |
Zoonou | £480 | a unit a day |
Published day counts run 5 to 10 days for a single platform, deriving to £5,000 to £10,000 (US$6,822 to US$13,644). Published fixed fees run £7,500 to £14,000 for one platform. iOS and Android are normally priced as separate targets, which is the single largest scoping decision in mobile work.
External network testing
Rate cards on the framework do not separate external from internal network testing, so the day-rate evidence for both is the network infrastructure table below. The fixed-fee evidence does separate them.
Supplier | Published price | Unit | Basis |
|---|---|---|---|
EJN Labs | £6,500 to £12,000 | per engagement, 3 to 5 days | |
Precursor Security | £3,750 to £6,250+ | per engagement, 3 to 5 days |
At the index median day rate, 3 to 5 days derives to £3,000 to £5,000 (US$4,093 to US$6,822). Precursor's published band sits almost exactly on that derivation; EJN Labs' sits above it, which is consistent with a deeper published scope at the same day count.
Internal network testing
Supplier | Published price | Unit | Basis |
|---|---|---|---|
EJN Labs | £1,200 to £3,600 | per engagement, 1 to 3 days, up to about 150 hosts | |
Periculo | £750 | a unit a day | |
Precursor Security | £6,250 to £10,000+ | per engagement, 5 to 8 days | |
PureCyber | £750 to £1,400 | a unit a day | |
Razor Thorn Security | £850 to £1,150 | a unit a day |
The two published fixed-fee bands look irreconcilable until the day counts are read: 1 to 3 days against 5 to 8 days. Both resolve to almost exactly £1,200 a day. This is the clearest example in the index of a price gap that is entirely a scope gap.
Cloud testing
Supplier | Published price | Unit | Basis |
|---|---|---|---|
Claranet | £1,000 to £1,500 | a unit a day | |
Coda Security (AWS) | £1,000 to £1,500 | a unit a day | |
Coda Security (Azure) | £1,000 to £1,500 | a unit a day | |
Salus Digital Security | £650 to £1,200 | a user a day | |
Salus Digital Security (services listing) | £650 to £1,200 | a unit a day |
Cloud carries the second-highest median day rate in the index at £1,250. Published day counts are short, 4 to 5 days for a single platform, deriving to £4,000 to £5,000 (US$5,458 to US$6,822). Published fixed fees run higher at £8,000 to £14,000, which is where the divergence between a configuration review and an exploitation-led cloud test shows up in the price.
Red team and adversary simulation
Supplier | Published price | Unit | Basis |
|---|---|---|---|
Bulletproof Cyber | £1,400 | a unit a day | |
CGI IT UK | £980 to £1,600 | a unit a day | |
Dionach | £1,600 | a unit a day | |
EJN Labs | £15,000 to £35,000 | per engagement, 2 to 3 weeks | |
Precursor Security | £15,000 to £50,000+ | per engagement |
At the red team median of £1,400 a day, a 10 to 15 day exercise derives to £14,000 to £21,000 (US$19,102 to US$28,652), which brackets the low end of both published fixed-fee bands. Anything published above £35,000 implies either a longer campaign or a regulated framework such as TIBER-EU or CBEST. Stingrai's own red team engagement cost breakdown covers how those frameworks change the day count.
Social engineering and phishing
Supplier | Published price | Unit | Basis |
|---|---|---|---|
Claranet | £1,000 to £1,500 | a unit a day | |
EJN Labs | £6,000 to £15,000 | per engagement, 7 to 10 days | |
PA Consulting Services | £750 | a unit a day | |
Prism Infosec | £875.00 to £1,200 | a unit a day |
At the index median, 7 to 10 days derives to £7,000 to £10,000 (US$9,551 to US$13,644), which sits inside the published fixed-fee band. Social engineering is the category where published day rates and published fees agree most closely, most likely because the deliverable is well standardised.
Multi-service listings
Six of the 30 rate cards price penetration testing as a single service line covering several engagement types. They are the best available proxy for a firm's blended rate.
Supplier | Published price | Unit | Basis |
|---|---|---|---|
BAE Systems Applied Intelligence | £525 | a unit a day | |
Cyber Security Specialists | £700 to £1,250 | a unit a day | |
DigitalXRAID | £800 to £1,150 | a unit a day | |
DigitalXRAID (CHECK) | £800 to £1,250 | a unit a day | |
Fortis Cyber Security | £745 to £1,245 | a unit a day | |
Predatech | £750 | a unit a day |
Published fixed-fee price lists
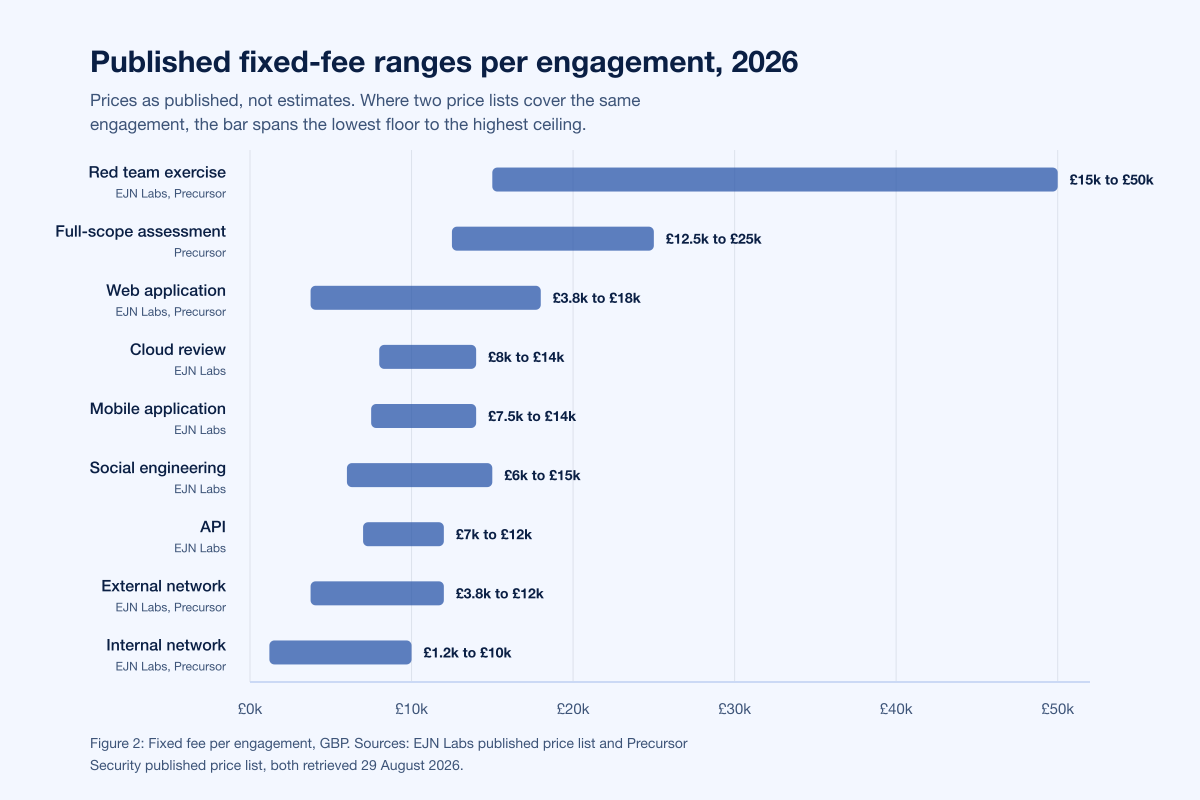
Two firms publish a complete per-engagement price table with day counts attached. Listed alphabetically.
Engagement | EJN Labs | Precursor Security |
|---|---|---|
Web application | £8,000 to £18,000 (6 to 12 days) | £3,750 to £6,250+ (3 to 5 days) |
Mobile application, one platform | £7,500 to £14,000 (5 to 10 days) | not separately published |
API | £7,000 to £12,000 (4 to 9 days) | not separately published |
Cloud review, single platform | £8,000 to £14,000 (4 to 5 days) | not separately published |
External infrastructure | £6,500 to £12,000 (3 to 5 days) | £3,750 to £6,250+ (3 to 5 days) |
Internal network | £1,200 to £3,600 (1 to 3 days, about 150 hosts) | £6,250 to £10,000+ (5 to 8 days) |
SaaS platform | not separately published | £6,250 to £8,750 (5 to 7 days) |
Secure code review | £7,000 to £12,000 (4 to 7 days) | not separately published |
AI and LLM testing | £6,000 to £12,000 (5 to 7 days) | not separately published |
Phishing and social engineering | £6,000 to £15,000 (7 to 10 days) | not separately published |
Red team | £15,000 to £35,000 (2 to 3 weeks) | £15,000 to £50,000+ |
Full-scope assessment | not separately published | £12,500 to £25,000+ (10 to 20 days) |
Managed vulnerability scanning | not separately published | £300 to £2,000 per month |
Sources: EJN Labs and Precursor Security, both retrieved 29 August 2026.
Both firms also publish the day rate their fees are built from: approximately £1,200 per accredited consultant day at Precursor, and a stated market band of £1,100 to £1,400 at EJN Labs. SECFORCE publishes a third benchmark, calling £1,000 to £1,500 the typical range for thorough manual testing and £1,200 a fair day rate, while flagging anything under £500 a day as unlikely to be a real penetration test. Those three benchmarks and this index's measured median of £1,000 agree within about 20%, which is unusually tight for a market this fragmented.
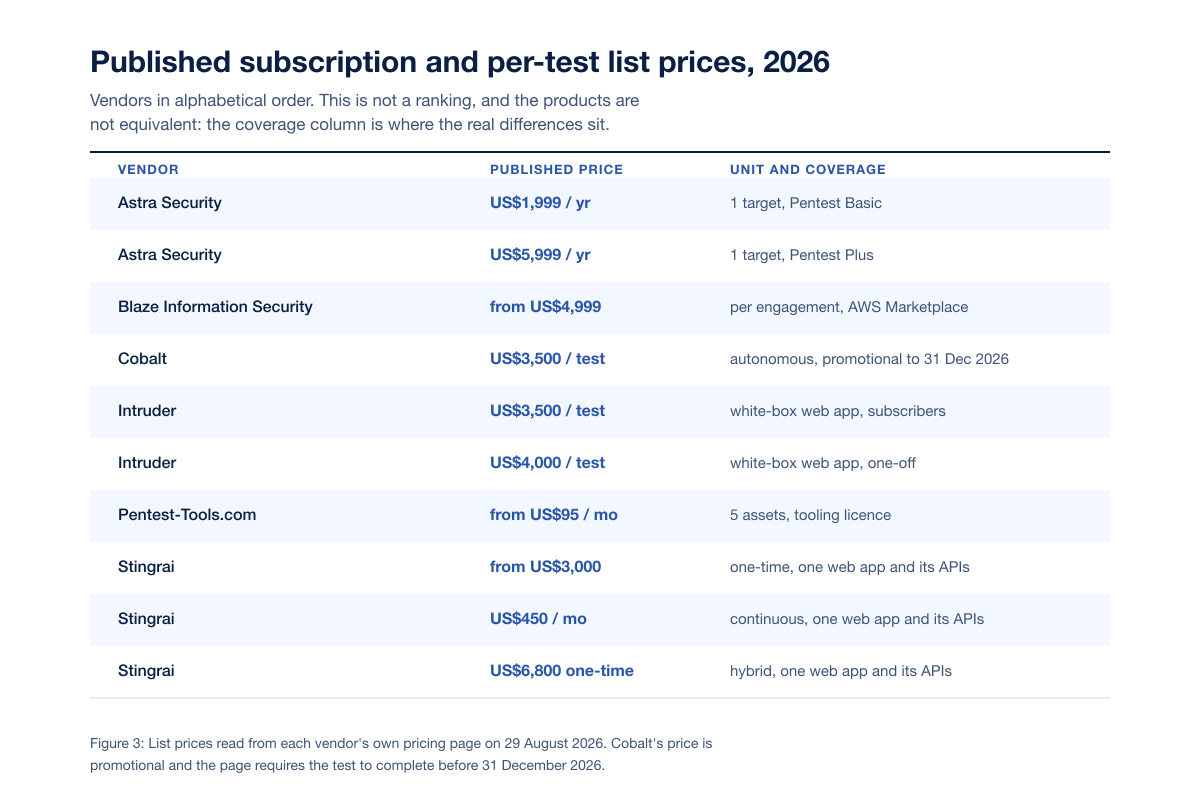
Subscription, per-test, and platform list prices
The fastest-moving part of the market is the part that publishes prices. Every row below was read from the vendor's own pricing page. Rows are ordered alphabetically by vendor. This is not a ranking and it is not a feature comparison; the products in it are not equivalent, and the "what it covers" column is where the real differences live.
Vendor | Published price | Unit | What it covers |
|---|---|---|---|
US$1,999/yr | 1 target | Pentest Basic: automated plus manual testing, 1 re-scan | |
US$5,999/yr | 1 target | Pentest Plus: manual testing, cloud config review, API testing, 2 re-scans | |
US$69/m to US$499/m | 1 to 5 targets | Scanner tiers, automated only | |
from US$4,999 | per engagement | Web application, API, or startup package, listed on AWS Marketplace | |
US$3,500 per test | per test | Autonomous Pentest, web application. Promotional: the page states the test must be initiated and completed before 31 December 2026 to qualify | |
US$3,500 per test | per test | White-box web application pentest, platform subscribers | |
US$4,000 per test | per test | Same scope, one-off purchase | |
from US$95/m to US$190/m | 5 assets | Tooling subscription, not a delivered engagement | |
at US$3,000 | one-time | Autonomous Pentest with Snipe, one web application and its APIs | |
US$650/m | 12-month engagement | Autonomous Pentest, continuous, one web application and its APIs | |
US$6,800 one-time, or US$1,275/m | one-time, or 12-month engagement | Hybrid Pentest, Snipe plus penetration testers, one web application and its APIs |
Two caveats belong on this table. First, Pentest-Tools.com sells tooling, not an engagement: comparing US$95 a month against US$3,500 a test compares a scanner licence against a delivered report, and buyers who make that comparison end up unhappy. Second, Cobalt's US$3,500 figure carries an explicit promotional deadline on the page, so it is a real published price today and may not be one in January.
What moves a quote up or down
The index measures the price of a day. Almost everything that moves a total quote moves the number of days.
Moves a quote up.
Roles and authorisation matrices. Each additional user role roughly doubles the authorisation test matrix. This is the single most reliable driver in application testing, and it is why two "one web app" quotes can differ by a factor of three.
Host and endpoint counts. Published price lists tie internal network testing directly to host count, with one price list explicitly scoping its lowest band at up to about 150 hosts.
Separate mobile platforms. iOS and Android price as two targets almost everywhere.
Regulated red team frameworks. TIBER-EU, CBEST, GBEST, and CREST STAR add threat intelligence, regulator liaison, and reporting overhead. Framework-aligned adversary simulation is the only category on the rate cards priced at £1,600 a day.
Report reformatting for auditors. Rewriting findings into an auditor's expected format is a real line item, published as a distinct cost by more than one firm.
Scope discovered mid-test. Undocumented subdomains, API endpoints, and cloud accounts found during reconnaissance are the most common cause of a change order.
Moves a quote down.
Bundling engagements. Reconnaissance, setup, project management, and reporting are shared across targets, so a second application in the same engagement prices well below the first.
Grey-box or white-box access. Credentials, architecture diagrams, and source access cut discovery time. Two vendors in this index publish white-box web application testing as their standard per-test product rather than a premium.
Continuous rather than annual purchasing. Subscription pricing spreads the shared overhead across a year. Published continuous coverage for one application starts at US$650 a month, against a published one-time price of US$3,000 for the equivalent scope.
Public-sector framework purchasing. Framework rate cards are published, competed, and generally sit at or below the private-market equivalent.
Retests included rather than billed. Several published prices bundle retesting; where they do not, budget for it separately.
How to use this index
Normalise to a day rate before comparing anything. Divide the quoted fee by the quoted number of tester days. If a vendor will not state the day count, that is the finding, not the price.
Sanity-check against £800 to £1,200. A day rate materially below that band is worth a conversation about who is actually doing the testing and how much of it is automated. A day rate materially above it should come with a specific reason: a regulated framework, a specialist platform, or a named tester.
Compare scopes, not totals. The internal network rows in this index differ by a factor of five on price and by a factor of five on days. The rate is the same. That pattern repeats everywhere.
Check the billable unit. "One application" sometimes includes its APIs and its cloud account, and sometimes does not. Ask the question in writing before you compare two numbers.
Ask what the price excludes. Retesting, report reformatting for an audit, out-of-hours testing, and travel are the four exclusions that most often turn a good quote into a bad invoice.
Estimate your own scope before you go to market. The pentest cost calculator turns a scope into a point estimate with the model's assumptions shown, so you arrive at the vendor conversation with a number of your own.
Update cadence
This index is refreshed quarterly. Each refresh re-fetches every source URL, re-reads every price on the page it was published on, records any change, and re-computes the aggregates from the updated table. Rate cards move when a procurement framework iterates, and vendor list prices move whenever a vendor decides they should, so the numbers here carry the date of the pass that produced them: 29 August 2026. Figures that can no longer be re-read on a live source at the next pass are removed rather than carried forward.
Frequently Asked Questions
How much does a penetration test cost in 2026?
The median published penetration testing day rate in this index is £1,000, about US$1,364, measured across 30 public-sector rate cards on the UK Government's G-Cloud 14 framework, with a central band of £800 to £1,200. Converted at that median rate and at published day counts, a single web application test derives to roughly £3,000 to £12,000, and a focused red team exercise to £14,000 to £21,000 once the higher red team day rate of £1,400 is applied. Published fixed fees confirm the shape: Precursor Security lists a web application test at £3,750 to £6,250+ and EJN Labs lists one at £8,000 to £18,000, the difference being scoped days.
What is a normal penetration testing day rate?
£800 to £1,200 (US$1,092 to US$1,637) covers the middle half of the published market. The full published spread runs £480 to £1,600. Three independent published benchmarks agree with the measured median: approximately £1,200 per accredited consultant day at Precursor Security, £1,100 to £1,400 at EJN Labs, and £1,200 as a fair rate at SECFORCE.
Which type of penetration test is most expensive?
By day rate, red team and adversary simulation, at a median of £1,400 (US$1,910) across three published rate cards, with the top of the range at £1,600 for framework-aligned work such as GBEST and CREST STAR (Dionach). By total engagement price, red team again, at a published £15,000 to £50,000+, because the day counts run 10 to 15 days or more rather than 3 to 5.
How much does a web application penetration test cost?
Published fixed fees run £3,750 to £18,000 depending on scope depth, over 3 to 12 tester days. Published per-test list prices for AI-assisted white-box web application testing are lower and narrower in scope: US$3,000 one-time or US$650 per month continuous for one application and its APIs at Stingrai, US$3,500 per test for platform subscribers and US$4,000 one-off at Intruder, and a promotional US$3,500 per test at Cobalt.
Why do two quotes for the same scope differ so much?
Almost always because the scopes are not the same. The clearest example in this index is internal network testing, where one published price list quotes £1,200 to £3,600 and another quotes £6,250 to £10,000+ for what reads as the same service. The first is scoped at 1 to 3 days for up to about 150 hosts; the second at 5 to 8 days. Both resolve to roughly £1,200 a day. Divide by days before you compare.
Do penetration testing vendors publish their prices?
Most do not. Six AWS Marketplace penetration testing listings were sampled for this index, from four sellers; only one seller publishes a number, and it publishes the same starting price across its three listings. HackerOne's pentest page publishes no price. Cobalt publishes what a credit is worth in testing time, one credit equals eight hours, without publishing what a credit costs. Public procurement frameworks are the main reason a published-price index is possible at all.
What does a pentest credit or a testing hour actually buy?
Credit models convert money into tester time, so the useful question is the implied hourly rate. Cobalt defines one credit as the equivalent of eight hours of offensive security testing. Applying that same eight-hour convention to the index median day rate of £1,000 gives an implied benchmark of £125 (about US$171) per tester hour. Compare any credit price against that before you buy a block of them.
How much does continuous or subscription penetration testing cost?
Published entry prices are US$650 per month on a 12-month engagement for autonomous testing of one web application and its APIs, and US$1,275 per month for the hybrid equivalent with penetration testers working alongside the agent (Stingrai). Annual PTaaS list prices start at US$1,999 per year for one target (Astra Security). Scanning and tooling subscriptions start lower, from US$95 per month for five assets (Pentest-Tools.com), but they license software rather than deliver an engagement.
What is the difference between a price index and a cost guide?
A price index records prices that were actually published, each linked to the page it was read from, and states what it dropped. A cost guide explains what drives a price and estimates ranges. Both are useful and they answer different questions. Stingrai's penetration testing cost guide for 2026 is the cost guide; this page is the index.
How often is this index updated?
Quarterly. Every source URL is re-fetched, every price re-read on its source page, and the aggregates re-computed from scratch. The figures on this page carry the date of the pass that produced them, 29 August 2026. Anything that cannot be re-read on a live source at the next pass is removed rather than carried forward.
What this means for buyers
Put the day count in the RFP. Asking for a fee invites incomparable answers. Asking for a fee plus tester days plus tester seniority makes every response comparable in a spreadsheet.
Budget the retest. It is included in some published prices and absent from others, and it is the most common gap between a quoted number and a paid invoice.
Buy continuous coverage where the code changes weekly. An annual test prices a snapshot. Published continuous list prices now start below the published one-time price for the same scope, which changes the arithmetic for teams shipping continuously.
Do not treat a low day rate as a saving. A £500 day rate over 12 days costs more than a £1,200 day rate over 4 days and is unlikely to buy the same depth.
Use the framework listings as leverage. Rate cards on a public framework are published, competed, and public. They are the cleanest negotiating reference available in this market.
Stingrai runs both models: one-time penetration tests and continuous testing programmes, delivered by penetration testers working alongside Snipe throughout the engagement. Prices for one web application and its APIs are published on the pricing page, and larger scopes are quoted from the same model that drives the cost calculator.
Provider guides
Rate cards tell you what a test should cost. These ranked guides cover who to buy it from:
Cite this index
This index is free to quote, screenshot, and build on. If you use a figure from it, please attribute it to the Stingrai Penetration Testing Price Index 2026 and link back to this page so readers can reach the underlying sources. Journalists, analysts, and procurement teams who want the per-listing breakdown behind a specific aggregate can request it through the contact form.
Suggested citation: Stingrai, Penetration Testing Price Index 2026, September 2026, https://www.stingrai.io/blog/penetration-testing-price-index-2026.
References
UK Government Digital Marketplace. G-Cloud 14 penetration testing service listings. Retrieved 29 August 2026. https://www.applytosupply.digitalmarketplace.service.gov.uk/g-cloud/services/266289063333452. Supplier-declared day rates published under a public procurement framework; 30 listings form the day-rate index in this post.
Precursor Security. Penetration Testing Cost UK. Retrieved 29 August 2026. https://www.precursorsecurity.com/services/offensive-security/penetration-testing/cost. Published fixed-fee table with day counts and a stated accredited-consultant day rate.
EJN Labs. Penetration Testing Cost UK: 2026 Pricing Guide. Page last modified 7 August 2026, retrieved 29 August 2026. https://ejnlabs.com/penetration-testing-cost-uk/. Published fixed-fee table covering twelve engagement types with day counts.
SECFORCE. Pen Testing Price List UK and EU Guide 2026. Retrieved 29 August 2026. https://www.secforce.com/the-blog/pen-testing-price-list-uk-and-eu-guide-2025/. Published day-rate benchmark with a worked engagement example.
Stingrai. Pricing. Retrieved 29 August 2026. https://www.stingrai.io/pricing. Published one-time and continuous prices for one web application and its APIs.
Astra Security. Pricing. Retrieved 29 August 2026. https://www.getastra.com/pricing. Published annual PTaaS and scanner list prices with a stated definition of a billable target.
Cobalt. Pricing. Retrieved 29 August 2026. https://www.cobalt.io/pricing. Published promotional per-test price and the definition of a credit as eight hours of testing.
Intruder. Pentest pricing. Retrieved 29 August 2026. https://www.intruder.io/pentest-pricing. Published per-test prices for platform subscribers and one-off purchasers.
Pentest-Tools.com. Pricing. Retrieved 29 August 2026. https://pentest-tools.com/pricing. Published per-asset monthly subscription prices for three tooling tiers.
Blaze Information Security. AWS Marketplace professional services listings. Retrieved 29 August 2026. https://aws.amazon.com/marketplace/pp/prodview-batqfzkeni3cm. Published starting prices for web application, API, and startup penetration testing packages.
HackerOne. Pentest product page. Retrieved 29 August 2026. https://www.hackerone.com/product/pentest. Cited as evidence that no price is published, one of this index's negative findings.
Board of Governors of the Federal Reserve System. H.10 Foreign Exchange Rates. Observation dated 21 August 2026, retrieved 29 August 2026. https://www.federalreserve.gov/releases/h10/current/. Source of the US$1.3644 per GBP rate used for every conversion on this page.
Stingrai. Penetration Testing Cost in 2026: Pricing Guide and Tables. https://www.stingrai.io/blog/penetration-testing-cost-2026. Companion cost guide covering the drivers behind the prices indexed here.
Stingrai. Pentest cost calculator. https://www.stingrai.io/tools/pentest-cost-calculator. Scope-driven estimate model with its assumptions and anchors published alongside the output.