




The global penetration testing market reaches US$2.72 billion in 2026 and is on track to reach US$5.54 billion by 2031, a 15.29% compound annual growth rate (Mordor Intelligence, Penetration Testing Market). A second independent forecast from Fortune Business Insights sizes the same market higher, at US$3.09 billion in 2026 heading to US$7.41 billion by 2034. The spending is not abstract. It tracks a hard change in how breaches start: vulnerability exploitation is now the single most common initial access vector, behind 31% of breaches and, for the first time on record, ahead of stolen credentials (Verizon 2026 Data Breach Investigations Report).
Two forces sit underneath that growth. Regulators now name penetration testing as a recurring obligation rather than a nice-to-have, with PCI DSS v4.0.1 mandating internal and external tests at least every 12 months and after every significant change (PCI Security Standards Council). And the delivery model is shifting from the once-a-year consulting engagement toward continuous, platform-delivered testing: the Penetration Testing as a Service segment is forecast to grow from US$0.72 billion in 2026 to US$1.98 billion by 2031, a 22.6% CAGR (MarketsandMarkets), more than a third faster than the market as a whole. This reference is written for the security buyers, CISOs, and journalists who need those numbers in one place, each traceable to its publisher.
This post is the Stingrai research team's canonical 2026 reference for penetration testing statistics. It aggregates roughly 30 hard figures from eight primary publishers, Mordor Intelligence, Fortune Business Insights, MarketsandMarkets, Cobalt, Verizon, OWASP, the PCI Security Standards Council, and the European supervisory frameworks, so a claim can be checked without chasing eight reports. Lead market and finding data is full-year 2025 telemetry reported in 2026, the freshest available, plus market forecasts published for 2026; primary publishers have not yet released full-year 2026 telemetry as of August 2026. Every figure carries its source, year, and methodology window so any claim can be audited inline.
Key penetration testing statistics at a glance (2026)
Penetration testing market size (2026): US$2.72 billion, forecast to US$5.54 billion by 2031 at a 15.29% CAGR (Mordor Intelligence).
Second market estimate (2026): US$3.09 billion, forecast to US$7.41 billion by 2034 at an 11.60% CAGR (Fortune Business Insights).
PTaaS market size (2026): US$0.72 billion, forecast to US$1.98 billion by 2031 at a 22.6% CAGR, the fastest-growing delivery model (MarketsandMarkets).
Top initial access vector (2026): vulnerability exploitation, behind 31% of breaches, now ahead of stolen credentials for the first time (Verizon 2026 DBIR).
Remediation gap (2026): the top 10% of teams resolve high-risk findings with a 10-day half-life; the bottom 10% sit at 249 days, a 25x spread (Cobalt State of Pentesting 2026).
Findings that actually get fixed (2025): less than half, 48%, of all pentest findings are remediated; 69% of serious findings are resolved (Cobalt State of Pentesting 2025).
Median time to resolve (2025): 67 days across all severities, roughly five times the 14-day SLA most teams set (Cobalt State of Pentesting 2025).
Most common finding class (2025): broken access control, ranked first in the OWASP Top 10:2025 and affecting virtually every tested application (OWASP Top 10:2025).
AI and LLM findings (2026): 32% are rated high risk, appearing 2.7x more often than in the overall dataset, yet only 38% get resolved, the lowest fix rate of any category (Cobalt State of Pentesting 2026).
Who runs the tests (2025): third-party managed services account for 73.44% of the market, and North America for 38.27% (Mordor Intelligence).
Compliance cadence: PCI DSS v4.0.1 requires internal and external penetration testing at least every 12 months and after any significant change (PCI Security Standards Council).
Key takeaways
Discovery is no longer the bottleneck; remediation is. Penetration tests reliably surface the flaws that matter, but organizations remediate less than half of what they find, and only 48% of all findings across the Cobalt dataset get fixed at all (Cobalt, 2025). The single most useful benchmark in this entire report is the 25x gap between the fastest and slowest remediation programs (Cobalt, 2026). Buying a test is easy; building the fix loop is the hard part.
The market is growing because attacker economics changed, not because compliance calendars did. Vulnerability exploitation overtook stolen credentials as the top way breaches begin in 2026, at 31% of breaches (Verizon, 2026). When the fastest route into an organization is an unpatched flaw, proactive testing stops being a checkbox and becomes a control.
PTaaS is the growth story, but it is a delivery model, not a different product. The subscription, platform-delivered segment is growing at 22.6% a year, well above the 11.6% to 15.3% for the market overall (MarketsandMarkets, 2026; Fortune Business Insights, 2026; Mordor Intelligence, 2026). The work underneath is still a penetration test, delivered either as an annual engagement or as a continuous program.
The finding classes have not changed in a decade; the confidence gap has widened. Broken access control still tops the OWASP Top 10:2025 (OWASP, 2025), and 81% of organizations rate their security posture as strong even while a third of serious findings go unfixed (Cobalt, 2025). Testing exists to close that gap between belief and evidence.
AI systems are the new soft target inside the test. AI and LLM assessments produce high-risk findings at 2.7 times the rate of the overall dataset, and organizations resolve just 38% of them (Cobalt, 2026). The category with the worst fix rate is the one growing fastest in scope.
Methodology and sources
This reference aggregates published figures from eight primary publishers, each fetched and verified during a research pass with a cutoff of 21 August 2026. Market sizing comes from three independent analyst houses: Mordor Intelligence (Penetration Testing Market, 2025 base year, forecast to 2031), Fortune Business Insights (Penetration Testing Market, forecast to 2034), and MarketsandMarkets (Penetration Testing as a Service Market, forecast to 2031). Practice data, what tests find and how organizations respond, comes from the Cobalt State of Pentesting Report 2026 (16,500+ pentests across roughly 3,000 organizations over five years, plus a survey of 450 security professionals) and the Cobalt State of Pentesting 2025. Breach-vector context comes from the Verizon 2026 Data Breach Investigations Report. Finding taxonomy comes from the OWASP Top 10:2025, published in November 2025. Compliance cadence comes from PCI DSS v4.0.1, Requirement 11.4.
Three disciplines govern what appears here. Every figure is tied to a named primary publisher and its reporting year; secondary write-ups were used only to locate the primary and never as the citation. Where analyst houses disagree, both numbers are shown side by side rather than averaged, because a spread between reputable forecasts is information, not noise. And any figure that could not be reached on at least one verification pass against a named primary source was dropped rather than estimated, including several segment sub-percentages that a press summary cited but the underlying report did not confirm.
How big is the penetration testing market in 2026?
The penetration testing market sits between US$2.72 billion and US$3.09 billion in 2026, depending on which analyst house you read, and every credible forecast has it growing at a double-digit annual rate for the rest of the decade.
Publisher | Scope | 2025 | 2026 | Forecast | CAGR |
|---|---|---|---|---|---|
Penetration testing market | US$2.36B | US$2.72B | US$5.54B by 2031 | 15.29% | |
Penetration testing market | US$2.74B | US$3.09B | US$7.41B by 2034 | 11.60% | |
PTaaS segment only | not published | US$0.72B | US$1.98B by 2031 | 22.6% |
Table 1: Penetration testing market size by publisher, 2025 to forecast horizon. Sources as linked; figures as published in each firm's 2026 report.
The gap between Mordor's US$2.72 billion and Fortune's US$3.09 billion is a scoping difference, not a contradiction: the two firms draw their market boundaries slightly differently, which is exactly why both numbers belong in a reference like this one. What they agree on is direction and pace. Mordor's 15.29% CAGR and Fortune's 11.60% both describe a market compounding at more than four times the rate of global GDP.
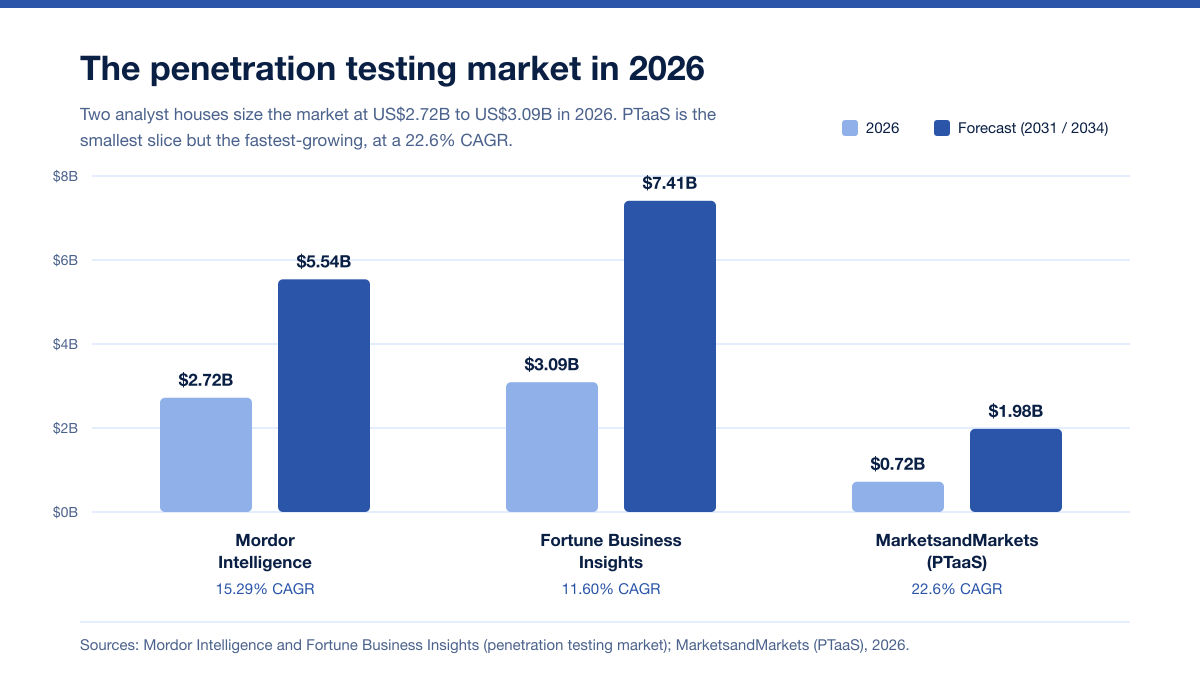
The most interesting number in Table 1 is the smallest one. The PTaaS segment is only US$0.72 billion in 2026, but at a 22.6% CAGR it is growing markedly faster than the parent market, which tells you where the spend is moving: from discrete annual engagements toward continuous, platform-delivered programs. For a full treatment of what buyers actually pay, see the 2026 penetration testing cost guide; for the delivery-model distinction, continuous pentesting versus PTaaS breaks down what the subscription actually buys.
Who buys penetration testing, and how do they run it?
Penetration testing is bought mostly as a service and mostly by large organizations, though the fastest growth is coming from outside both of those groups.
Dimension | Leading segment (2025) | Share | Fastest-growing segment | Growth signal |
|---|---|---|---|---|
Delivery mode | Third-party managed services | 73.44% | In-house teams | 15.64% CAGR |
Organization size | Large enterprises | 67.83% | Small and medium enterprises | 15.68% CAGR |
Region | North America | 38.27% | Asia-Pacific | 16.26% CAGR |
End-user industry | Banking and financial services | 28.68% | Healthcare and life sciences | 16.89% CAGR |
Table 2: Penetration testing market composition by delivery mode, organization size, region and industry. Source: Mordor Intelligence, 2026.
Nearly three-quarters of the market is delivered by third-party providers rather than in-house teams (Mordor Intelligence, 2026), which reflects a simple reality: independent testing is what auditors, customers, and boards accept as evidence, and independence is difficult to demonstrate with an internal team testing its own work. Banking and financial services remains the largest buyer at 28.68% of the market, consistent with the sector carrying the heaviest regulatory testing load.
The demand also has a clear behavioral driver. Cobalt's 2025 survey found that 94% of security leaders regard penetration testing as foundational to their program, even as 81% simultaneously rate their own security posture as strong (Cobalt, 2025). That combination, high confidence and high reliance on testing, is the tension the rest of this report measures.
What do penetration tests actually find in 2026?
The categories a penetration test surfaces have been remarkably stable for a decade, and the current authoritative taxonomy is the OWASP Top 10:2025, published in November 2025 after a full data-driven revision.
Rank | OWASP Top 10:2025 category | What a pentest checks for |
|---|---|---|
A01 | Broken Access Control | Privilege escalation, insecure direct object references (IDOR), server-side request forgery, token manipulation |
A02 | Security Misconfiguration | Default settings, verbose errors, unhardened services, exposed management interfaces |
A03 | Software Supply Chain Failures | Vulnerable and outdated components, compromised dependencies and build pipelines |
A04 | Cryptographic Failures | Weak or missing encryption, exposed secrets, poor key handling |
A05 | Injection | SQL, command, and cross-site scripting flaws |
A06 | Insecure Design | Missing security controls at the architecture level |
A07 | Authentication Failures | Weak session management, credential and MFA weaknesses |
A08 | Software or Data Integrity Failures | Unverified updates, insecure deserialization, CI/CD tampering |
A09 | Security Logging and Alerting Failures | Gaps that let attacks proceed undetected |
A10 | Mishandling of Exceptional Conditions | Unsafe handling of errors and edge cases |
Table 3: The OWASP Top 10:2025 web application risk categories. Source: OWASP Top 10:2025.
Two changes in the 2025 revision are worth a buyer's attention. Broken access control remains ranked first and, per OWASP, affects virtually every tested application, which is why authorization testing is the single highest-yield thing a competent tester does. And Software Supply Chain Failures rose to A03, an expansion of the older "vulnerable and outdated components" category that reflects how much attacker attention has moved to dependencies and build pipelines. The pattern in real-world pentest data has been consistent for years: access control and misconfiguration classes dominate the finding count, a distribution Cobalt has reported across multiple annual editions. Why automated scanners routinely miss the access-control classes is covered in why API scanners miss BOLA and IDOR.
There is a caution in the finding data that matters for anyone reading a vendor's "we found X critical issues" headline. The share of findings rated serious has actually fallen over the last decade, from 20% in 2015 to 11% in 2025, as application security programs matured (Cobalt, 2025). A lower serious-finding rate is a sign of progress, not of a weaker test. The exception is AI: LLM and AI assessments run far hotter, producing high-risk findings at 2.7 times the overall rate (Cobalt, 2026).
How long does remediation take, and how much gets fixed?
This is where the data turns uncomfortable. Penetration tests find the flaws; organizations then fail to fix most of them in any reasonable window.
Remediation metric | Figure | Year | Source |
|---|---|---|---|
High-risk findings half-life, top 10% of teams | 10 days | 2026 | |
High-risk findings half-life, bottom 10% of teams | 249 days | 2026 | |
Serious findings resolved | 69% | 2025 | |
All findings resolved | 48% | 2025 | |
Median time to resolve, all severities | 67 days | 2025 | |
Critical findings fixed in under 3 days, programmatic teams | 45% | 2026 | |
Critical findings fixed in under 3 days, compliance-driven teams | 10% | 2026 | |
AI and LLM findings resolved | 38% | 2026 |
Table 4: Penetration test remediation performance by metric. Sources: Cobalt State of Pentesting 2025 and 2026, as linked.
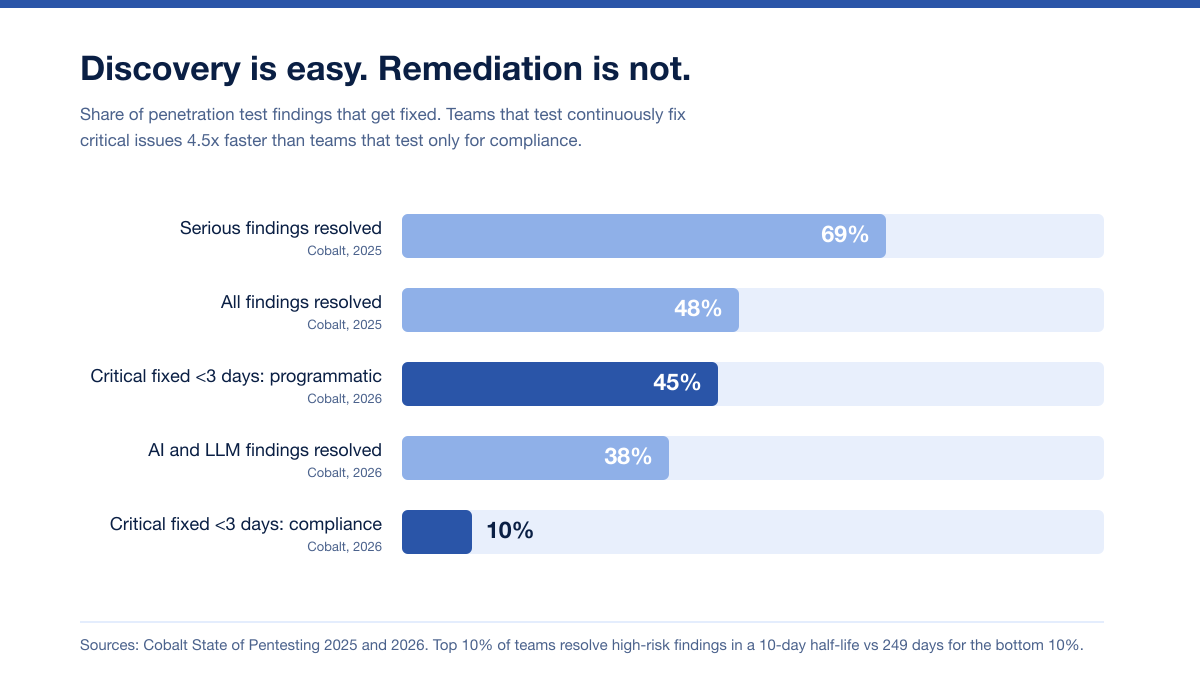
The headline figure is the 25x spread between the best and worst remediation programs: a 10-day half-life for high-risk findings among the top 10% of teams, versus 249 days for the bottom 10% (Cobalt, 2026). A half-life is the time it takes to resolve half of the findings in a cohort, so the laggards are leaving half of their high-risk issues open for the better part of a year. Cobalt estimates the under-performers carry roughly eight additional months of risk exposure compared with the leaders.
What separates the two groups is not the test; it is the operating model behind it. Teams that run testing as a continuous, developer-integrated program fix 45% of critical findings within three days, while teams that test only to satisfy a compliance date manage just 10% (Cobalt, 2026). The lesson is not that compliance testing is worthless, it is that a test whose findings do not flow into an engineering workflow produces a report, not a fix. That workflow question is the subject of integrating pentest findings into your developer workflow, and the related question of how long a report stays credible is covered in is your pentest report still valid?.
The worst-performing category is the newest one. Only 38% of AI and LLM findings get resolved, the lowest fix rate Cobalt records (Cobalt, 2026), even as 98% of organizations report incorporating generative AI into their products and only 66% run regular security assessments against those AI products (Cobalt, 2025).
How often should you run a penetration test?
Testing frequency is set by two things: what your regulators require, and how fast your systems change. The regulatory floor is clearest in PCI DSS, and the practical answer for most organizations is at least annually plus after any significant change.
Driver | What it requires | Cadence | Source |
|---|---|---|---|
PCI DSS v4.0.1 (11.4.2, 11.4.3) | Internal and external penetration testing | At least every 12 months and after any significant change | |
PCI DSS v4.0.1 (11.4.6) | Segmentation control testing, service providers | Every 6 months | |
SOC 2 and ISO 27001 | Testing not named as a line-item control, but routinely expected as evidence for monitoring and vulnerability-management controls | Annual, as standard practice | |
DORA threat-led penetration testing | Threat-led testing for designated financial entities | At least every 3 years | |
General best practice | Testing after any significant architectural, application, or infrastructure change | Annual plus change-triggered | Industry practice |
Table 5: Penetration testing frequency by compliance driver. Sources as linked; PCI DSS v4.x became mandatory on 31 March 2025.
PCI DSS is the one framework that names penetration testing as an explicit, dated obligation. Requirement 11.4 mandates a documented methodology (11.4.1), internal testing at least every 12 months and after significant change (11.4.2), external testing on the same cadence (11.4.3), correction of exploitable findings followed by a retest to confirm the fix (11.4.4), and segmentation testing every 12 months, tightened to every 6 months for service providers (11.4.5 and 11.4.6) (PCI Security Standards Council). The full PCI treatment is in PCI DSS penetration testing in 2026.
SOC 2 and ISO 27001 work differently. Neither standard names penetration testing as a specific control, so the honest answer is that they do not strictly mandate one. In practice, auditors routinely expect a recent penetration test as evidence for the monitoring and technical-vulnerability-management controls those frameworks do require, which is why annual testing has become standard practice for organizations pursuing either. What compliance frameworks genuinely require, versus what has become convention, is unpacked in penetration testing versus vulnerability assessment: what compliance frameworks really require and SOC 2 penetration testing in 2026. The deeper point is that a compliance calendar sets a floor, not a ceiling: if your systems ship weekly, an annual test leaves 51 weeks unexamined, which is the entire argument for a continuous program.
Why the market is growing: vulnerability exploitation is now the top breach vector
The clearest single reason organizations are spending more on offensive testing is that the attacker's fastest route in has changed. For the first time in the Verizon DBIR's history, vulnerability exploitation is the most common way a breach begins.
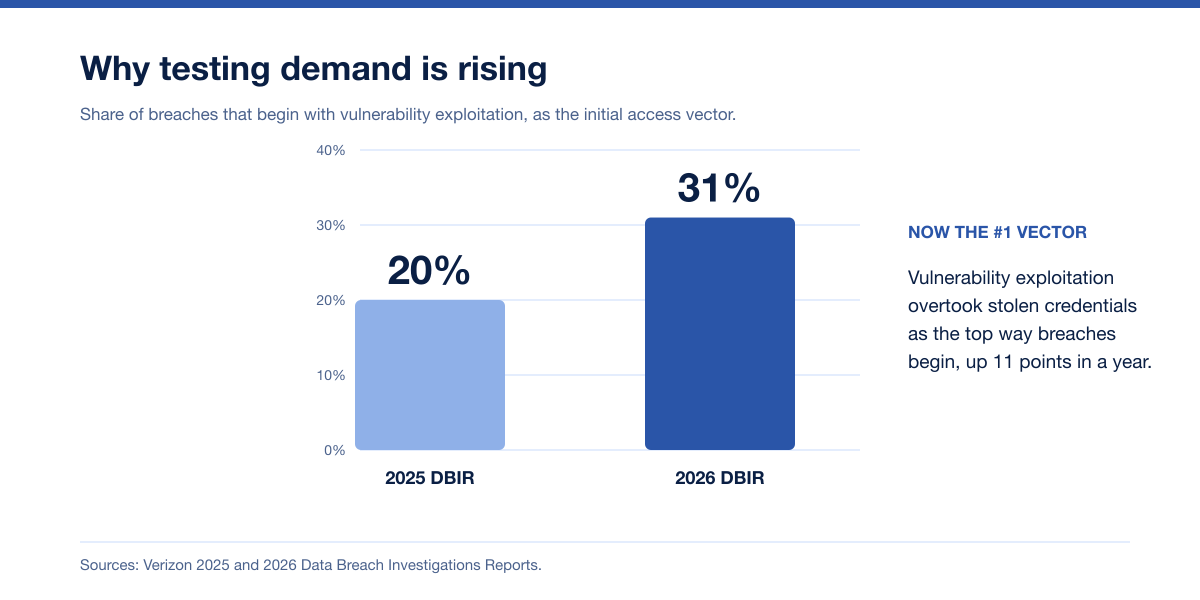
The 2026 Verizon DBIR reports that 31% of breaches now start with a software vulnerability, which the report states plainly beats stolen passwords as the top way attackers get in (Verizon, 2026). That is up from 20% in the 2025 edition, itself a 34% year-over-year jump at the time (Verizon, 2025). The trajectory is the story: an initial access method that was a distant third two years ago is now first.
This is the demand curve behind the market forecasts. When the most probable way into an organization is an exposed, exploitable flaw, the value of paying a skilled tester to find that flaw first rises accordingly. It also reframes what "coverage" means. A test scoped only to a web application login page does nothing about an exploitable edge device, which is why scoping the full attack surface, covered in how to scope a penetration test in 2026, has become the difference between a test that reduces breach risk and one that produces a certificate. For how this vector data sits alongside the wider threat picture, see the state of cybersecurity key statistics and trends.
Where AI fits into the numbers
Two AI trends run through this data and pull in opposite directions. On the buy side, AI is expanding the attack surface faster than testing is keeping up: 98% of organizations report building generative AI into their products, but only 66% run regular security assessments against those AI products (Cobalt, 2025). The findings that do surface are disproportionately severe, at 2.7 times the high-risk rate of the overall dataset, and disproportionately ignored, with only 38% resolved (Cobalt, 2026).
On the delivery side, AI is changing how tests are run, which is part of what makes the 22.6% PTaaS growth rate achievable: platform-delivered testing increasingly pairs automated, AI-assisted discovery with human depth on the classes machines miss. The distinction between what an automated agent handles well and what still needs a human operator is the subject of traditional pentesting versus AI pentesting and the AI pentest benchmark results for 2026.
What this means for your security program
The statistics point to one conclusion a buyer can act on: the value of a penetration test is realized at remediation, not at discovery. Three implications follow.
Budget for the fix loop, not just the test. The 25x remediation gap (Cobalt, 2026) is an operating-model gap. A test whose findings route straight into your engineering backlog with owners and SLAs is worth several times a test that produces a PDF. Ask any provider how findings are delivered, retested, and tracked, not just how they are found.
Match cadence to change velocity, not just to the audit date. If you ship continuously, an annual test is a floor set by compliance, not a ceiling set by risk. The growth in continuous PTaaS is the market pricing in exactly this gap. Both models have a place: an annual engagement for a stable estate, a continuous program for a fast-moving one.
Put AI systems inside the scope, not beside it. With only 66% of organizations testing their AI products and the worst fix rate of any category, AI is the clearest under-tested surface in the data.
Stingrai is a Toronto-headquartered offensive security firm founded in 2021, delivering penetration testing as both one-time annual engagements and continuous programs, as a CREST-accredited penetration testing service provider at the firm level. Its AI agent, Snipe, is an autonomous web application testing agent purpose-built to hunt the complex classes that dominate real-world findings, IDOR, broken authorization, and business-logic flaws, working alongside certified human pentesters throughout the engagement rather than after it. If you are scoping a test off the back of these numbers, the 2026 penetration testing cost guide and the PTaaS overview are the practical next reads, or you can get a quote scoped to your attack surface.
Start here: Get a Quote | Book a Free Scoping Call | PTaaS
Frequently Asked Questions
How much does the penetration testing market grow each year?
The penetration testing market is growing at a double-digit annual rate across every credible forecast. Mordor Intelligence puts it at US$2.72 billion in 2026, growing to US$5.54 billion by 2031, a 15.29% compound annual growth rate (Mordor Intelligence, 2026). Fortune Business Insights sizes it slightly higher at US$3.09 billion in 2026 with an 11.60% CAGR to 2034 (Fortune Business Insights, 2026). The fastest-growing slice is Penetration Testing as a Service, forecast to grow from US$0.72 billion in 2026 to US$1.98 billion by 2031 at a 22.6% CAGR (MarketsandMarkets, 2026).
What percentage of penetration tests find critical vulnerabilities?
Serious findings are common, but the share of findings rated serious has actually declined as programs mature, from 20% of all findings in 2015 to 11% in 2025 (Cobalt, 2025). A lower serious-finding rate reflects progress in application security, not a weaker test. The clear exception is AI: LLM and AI assessments produce high-risk findings at 2.7 times the overall rate (Cobalt, 2026). And one class remains near-universal regardless of severity mix: broken access control tops the OWASP Top 10:2025 and, per OWASP, affects virtually every tested application (OWASP, 2025).
How often should you run a penetration test?
At least once every 12 months and after any significant change is the working answer for most organizations. That cadence is an explicit mandate under PCI DSS v4.0.1, Requirement 11.4, for both internal and external testing (PCI Security Standards Council). SOC 2 and ISO 27001 do not name penetration testing as a specific control, but auditors routinely expect a recent test as evidence, so annual testing is standard practice. If your systems change frequently, an annual test leaves most of the year unexamined, which is the case for a continuous program. Full detail is in how often should you run a penetration test.
How long does penetration test remediation take?
Longer than most teams intend. The median time to resolve findings across all severities is 67 days, roughly five times the 14-day SLA most organizations set for themselves (Cobalt, 2025). Performance varies enormously: the top 10% of teams resolve high-risk findings with a 10-day half-life, while the bottom 10% sit at 249 days, a 25x spread (Cobalt, 2026). The difference is the operating model: teams that route findings into a continuous engineering workflow fix 45% of critical issues within three days, versus 10% for teams that test only for compliance.
What do penetration tests find most often?
Access-control and misconfiguration flaws dominate, a pattern that has held for a decade. The authoritative taxonomy is the OWASP Top 10:2025, which ranks Broken Access Control first, Security Misconfiguration second, and Software Supply Chain Failures third (OWASP, 2025). Broken access control, the family that includes IDOR, privilege escalation, and server-side request forgery, affects virtually every tested application, which is why authorization testing is the highest-yield work a skilled tester does and the class that automated scanners most often miss.
What percentage of vulnerabilities actually get fixed after a pentest?
Less than half. Across the Cobalt dataset, 48% of all findings are remediated, and 69% of the highest-risk serious findings are resolved (Cobalt, 2025). The worst-performing category is AI and LLM findings, of which only 38% get fixed (Cobalt, 2026). This remediation gap, not the discovery of flaws, is the central weakness the data exposes: organizations are broadly good at finding issues and broadly poor at closing them.
Why is the penetration testing market growing so fast?
Because the way breaches begin has shifted toward exploitable flaws. The 2026 Verizon DBIR reports that vulnerability exploitation is now the single most common initial access vector, behind 31% of breaches and, for the first time, ahead of stolen credentials (Verizon, 2026), up from 20% a year earlier. When the most probable route into an organization is an unpatched, exploitable vulnerability, proactive testing to find those flaws first becomes a control rather than a formality. Regulatory mandates such as PCI DSS and the shift toward continuous, platform-delivered PTaaS amplify the trend.
What is PTaaS, and why is it the fastest-growing segment?
Penetration Testing as a Service (PTaaS) delivers penetration testing through a subscription platform rather than as a discrete consulting engagement, so findings arrive continuously through a dashboard and testing can run on an ongoing schedule instead of once a year. It is the fastest-growing delivery model, forecast to grow at a 22.6% CAGR from US$0.72 billion in 2026 to US$1.98 billion by 2031 (MarketsandMarkets, 2026), well above the 11.6% to 15.3% growth of the market overall. PTaaS is a delivery model, not a different assessment: the work underneath is still a penetration test, which providers deliver as either an annual engagement or a continuous program. See continuous pentesting versus PTaaS for the distinction.
Who performs most penetration tests?
Third-party providers, by a wide margin. Independent, external providers account for 73.44% of the market, versus in-house teams, largely because auditors, customers, and boards accept independent testing as evidence in a way they do not accept a team testing its own work (Mordor Intelligence, 2026). Large enterprises are the biggest buyers at 67.83% of the market, and banking and financial services is the largest industry at 28.68%, reflecting the sector's regulatory testing load. For how to evaluate a provider, see how to evaluate a penetration test report.
Related reading
Penetration Testing Cost 2026 and Continuous Pentesting vs PTaaS
PCI DSS Penetration Testing 2026 and SOC 2 Penetration Testing 2026
Penetration Testing vs Vulnerability Assessment: What Compliance Frameworks Really Require
How to Scope a Penetration Test in 2026 and How to Evaluate a Penetration Test Report
Traditional Pentesting vs AI Pentesting and AI Pentest Benchmark Results 2026
The State of Cybersecurity: Key Statistics and Trends and Ransomware Payout Statistics 2026
Stingrai services: PTaaS, Web Application Penetration Testing, Network Penetration Testing, Pricing
References
Mordor Intelligence. Penetration Testing Market: Size, Share, Trends and Industry Report. 2026. https://www.mordorintelligence.com/industry-reports/penetration-testing-market. Market size US$2.72B (2026) to US$5.54B (2031) at 15.29% CAGR, with delivery-mode, organization-size, regional and industry segmentation.
Fortune Business Insights. Penetration Testing Market Size, Share and Growth Report. 2026. https://www.fortunebusinessinsights.com/penetration-testing-market-108434. Market size US$3.09B (2026) to US$7.41B (2034) at 11.60% CAGR, with regional and deployment-mode segmentation.
MarketsandMarkets. Penetration Testing as a Service (PTaaS) Market. 2026. https://www.marketsandmarkets.com/PressReleases/penetration-testing-as-a-service.asp. PTaaS segment US$0.72B (2026) to US$1.98B (2031) at 22.6% CAGR.
Cobalt. State of Pentesting Report 2026. 2026. https://resource.cobalt.io/state-of-pentesting-2026. 16,500+ pentests across roughly 3,000 organizations over five years, plus 450 surveyed security professionals; remediation half-life, programmatic-versus-compliance fix rates, and AI/LLM finding data.
Cobalt. State of Pentesting Report 2025. 2025. https://www.cobalt.io/blog/key-takeaways-state-of-pentesting-report-2025. Overall and serious remediation rates, median time to resolve, the decade-long serious-finding trend, and AI-adoption survey data.
Verizon. 2026 Data Breach Investigations Report. 2026. https://www.verizon.com/business/resources/reports/dbir/. Vulnerability exploitation as the leading initial access vector at 31% of breaches.
Verizon. 2025 Data Breach Investigations Report. 2025. https://www.verizon.com/business/resources/reports/2025-dbir-data-breach-investigations-report.pdf. Prior-year vulnerability-exploitation share of 20% and the 34% year-over-year increase.
OWASP. OWASP Top 10:2025. November 2025. https://owasp.org/Top10/2025/. The current web application risk taxonomy, with Broken Access Control ranked first and Software Supply Chain Failures newly ranked third.
PCI Security Standards Council. PCI DSS v4.0.1, Requirement 11.4. 2024, mandatory 31 March 2025. https://www.pcisecuritystandards.org/document_library/. Internal and external penetration testing at least every 12 months and after significant change, with segmentation testing and retest requirements.
Ready to act on these numbers?
The data is consistent on one point: the return on a penetration test comes from closing findings, not just from finding them. Stingrai runs penetration testing as one-time annual engagements and as continuous programs, with findings delivered into your engineering workflow and retested to confirm the fix. Tell us your attack surface and we will scope it.