Total on-chain ransomware payments tracked by Chainalysis fell to roughly US$820 million in 2025, the lowest full-year figure since 2021 and an 8% drop from 2024's revised US$892 million total, per the Chainalysis 2026 Crypto Crime Report. Even so, the volume of claimed victims on leak sites rose 50% to a record 7,874 globally, per NCC Group's Annual Cyber Threat Intelligence 2025. Fewer victims paid, but those who did paid more: the median on-chain ransom jumped 368% year over year to US$59,556, and Sophos's incident-response sample shows a median paid ransom of US$1.0 million (down from US$1.26 million in 2024).
This post is the Stingrai research team's canonical 2026 reference for ransomware payouts. It assembles 77 numeric claims from 20 named primary publishers, including Chainalysis, Coveware, Sophos State of Ransomware, Mandiant M-Trends, Verizon DBIR, IBM Cost of a Data Breach, FBI IC3, ENISA, NCC Group, Marsh, and Zscaler ThreatLabz. Lead data is full-year 2025 telemetry, the freshest available; primary publishers have not yet released full-year 2026 reports as of April 2026. Every figure carries its source, year, and methodology window so any claim can be audited inline.
TL;DR: 10 labeled key stats
Total on-chain ransomware payments (2025): ~US$820M tracked by Chainalysis, trending toward US$900M as more incidents are attributed (Chainalysis, 2026 Crypto Crime Report).
YoY change in on-chain payments (2024 → 2025): -8% (US$892M revised → US$820M) (Chainalysis).
Median on-chain ransom payment (2025): US$59,556, up 368% YoY (Chainalysis).
Median paid ransom in the Sophos survey (2025): US$1.0M, down from US$1.26M in 2024 (Sophos State of Ransomware 2025).
Share of Sophos respondents who paid and got data back (2025): 49% (Sophos).
Coveware Q4 2025 payment rate: 20%, an all-time low (Coveware Q4 2025).
Coveware Q4 2025 average payment: US$591,988, up 57% from Q3 (Coveware Q4 2025).
Total 2025 ransomware leak-site victims: 7,874, a record (NCC Group, Annual Cyber Threat Intelligence 2025).
Average cost of a ransomware incident (2025): US$5.08M (IBM Cost of a Data Breach 2025).
Largest publicly-tracked single ransom paid to date: US$75M to Dark Angels by a Fortune 50 victim (Zscaler ThreatLabz 2024 Ransomware Report).
Key takeaways
Volume is up, payments are down. Claimed victims on leak sites hit a record 7,874 in 2025 while on-chain payments fell 8% to roughly US$820M. Attackers are hitting more targets to net less money.
Payment rates are at historic lows. Chainalysis estimates 28% of victims paid in 2025 on-chain, Coveware measured 20% in Q4, and IBM reports 63% of ransomware victims refused to pay.
The median on-chain ransom jumped 368%. Big-game hunting is pulling the distribution rightward: fewer payers, bigger payments.
Manufacturing, professional services, and healthcare lead the target list. Manufacturing is up 61% YoY per the Verizon DBIR and accounts for 14.9% of EU ransomware claims per ENISA.
Data exfiltration is now the default. Coveware saw exfiltration in 94% of Q4 2025 incidents, and "recovery denial" style extortion has replaced pure encryption as the primary leverage.
Methodology
Sources used: Chainalysis (on-chain payment tracking), Coveware (incident-response caseload, reported quarterly), Sophos (annual global survey of 3,400 IT leaders across 17 countries), Mandiant M-Trends (incident-response caseload, annual), Verizon DBIR (global breach dataset covering 12,195 breaches Nov 2023 to Oct 2024), IBM Cost of a Data Breach 2025 (annual global survey), FBI IC3 (US complaint data, calendar year 2024), ENISA (EU incident corpus, July 2024 to June 2025), NCC Group (monthly leak-site telemetry plus annual summary), Marsh (cyber-insurance claims telemetry), and Zscaler ThreatLabz (ransomware visibility across Zscaler customer telemetry).
Date cutoff: April 22, 2026. We lead with full-year 2025 data where a primary source has published it. Where Q1 2026 telemetry was available from quarterly publishers at the time of writing (e.g., partial NCC Group monthly pulses), it is clearly labeled. Statistics that could not be reached via a primary source on at least one HTTP 200 fetch were dropped rather than estimated.
Excluded: secondary reposts, vendor blog aggregations that do not add methodology, AI-generated summaries, and any figure that could not be pinned to a named publisher and year. We also did not include 2026 full-year numbers because 2026 is incomplete as of this writing.
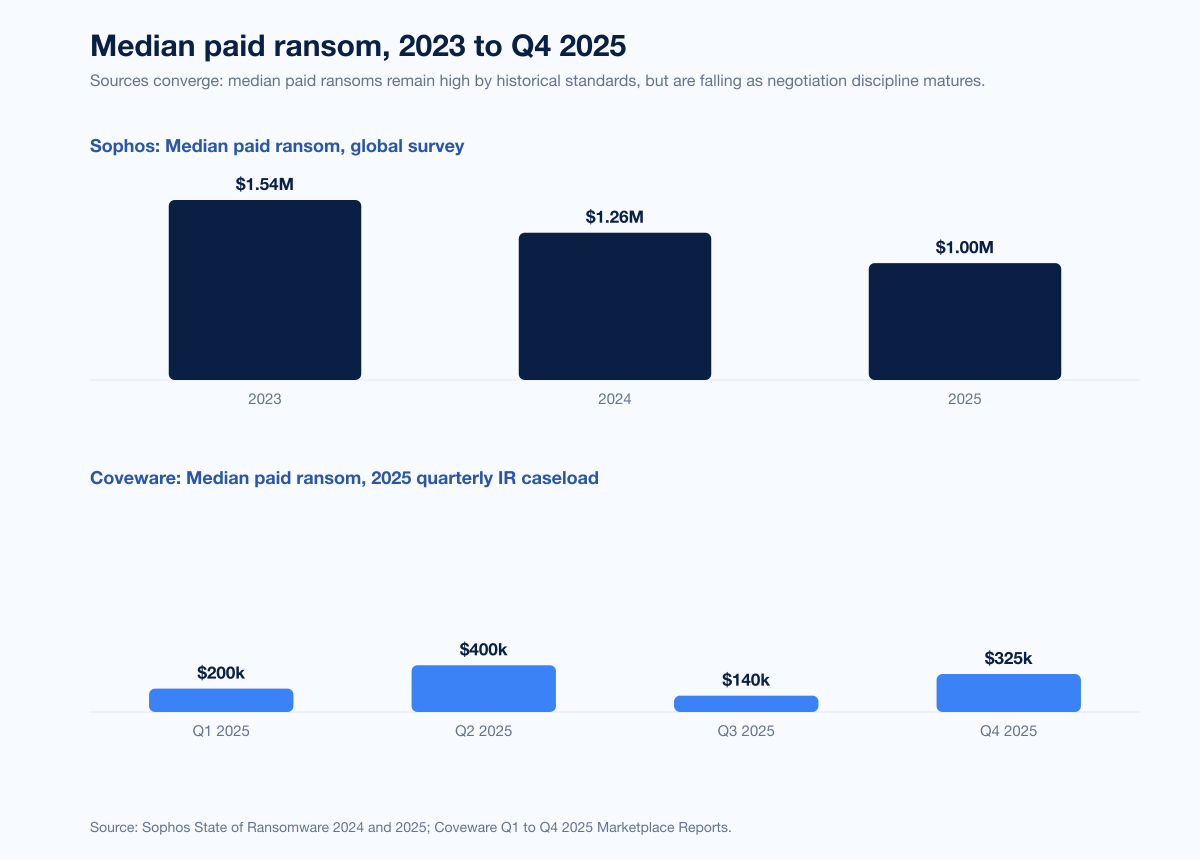
Figure 1: Average paid ransom, annual, 2020-2025. Annual averages computed from Coveware quarterly marketplace reports (Q1 2025: US$200k median proxy, Q2: US$1.13M, Q3: US$377k, Q4: US$592k) and Sophos 2025. 2020-2023 back-history from Sophos State of Ransomware 2024. Source: Sophos State of Ransomware 2025; Coveware Q4 2025 Marketplace Report.
How much victims are paying in 2026
On-chain data and incident-response data tell slightly different stories, because Chainalysis sees every attribution-linked wallet while Coveware and Sophos see only the cases they negotiate or survey. Both matter. On-chain data is the ceiling; IR data is the center of the distribution.
On-chain view (Chainalysis)
Chainalysis published its 2026 Crypto Crime Report preview on ransomware in early 2026. Headline numbers for 2025:
Metric | 2023 | 2024 (revised) | 2025 | Source |
|---|---|---|---|---|
Total on-chain victim payments (USD) | US$1.25B | US$892M | ~US$820M | Chainalysis 2026 Crypto Crime Report |
YoY change | reference | -29% | -8% | Chainalysis |
Median ransom payment | not disclosed | US$12,738 | US$59,556 | Chainalysis 2026 Crypto Crime Report |
Share of victims paying | ~41% est. | ~32% est. | 28% (record low) | Chainalysis 2026 Crypto Crime Report |
Chainalysis notes that the 2025 total "is likely to approach or exceed US$900 million as we attribute more events and payments." The 2024 figure was similarly revised upward from an initial US$813.55M to US$892M in the 2026 update, so the gap between 2023's record US$1.25B and 2025 is narrower than an early snapshot suggests. The important direction is the +368% jump in the on-chain median, which reflects fewer ransoms flowing but larger ones when they do.
Incident-response view (Coveware)
Coveware publishes quarterly marketplace reports based on its incident-response caseload. Quarterly paid-ransom figures for 2025 show heavy volatility driven by a handful of large payments each quarter:
Quarter | Average Payment | Median Payment | Payment Rate | Source |
|---|---|---|---|---|
Q2 2025 | US$1,130,070 | US$400,000 | 26% | Coveware Q2 2025 Marketplace Report |
Q3 2025 | US$376,941 | US$140,000 | 23% | Coveware Q3 2025 Marketplace Report |
Q4 2025 | US$591,988 | US$325,000 | 20% | Coveware Q4 2025 Marketplace Report |
Coveware's Q1 2025 Marketplace Report reported a median paid ransom of US$200,000, but did not publish a directly-comparable average or full-caseload payment rate in the public excerpts we verified, so we omit Q1 from the table rather than pad it with missing values.
Averages move because Coveware's distribution is long-tailed: a single US$15M payment can swing the quarterly mean. Medians are the more honest indicator, and even medians moved from US$200k to US$325k across the year. Payment rate is the most-cited number because it is a clean proxy for attacker leverage: only 1 in 5 Coveware-touched victims actually paid in Q4.
Sophos survey view
Sophos's State of Ransomware 2025 surveyed 3,400 IT and cybersecurity leaders across 17 countries whose organizations suffered ransomware in the prior year. It reports:
Median ransom payment: US$1.0M (2025), down from US$1.26M (2024).
Median ransom demand: US$1.20M (2025), down 56% from US$2.75M (2024).
Share who paid and got data back: 49%.
Share who paid less than the initial demand: 53%; 29% paid the initial demand; 18% paid more.
Average recovery cost (excluding ransom): US$1.53M, down 44% from US$2.73M in 2024.
Share of organizations fully recovered within a week: 53%, up from 35% in 2024.
The Sophos sample skews toward larger enterprises than Coveware's, which is why its median paid ransom sits near US$1M while Coveware's quarterly medians hover between US$140k and US$400k. Neither is wrong. They reflect different slices of the victim universe.
Reconciling the three data sources
Source | Population | Median paid ransom (2025) | Payment rate (2025) |
|---|---|---|---|
Chainalysis | All on-chain ransomware flows globally | US$59,556 | 28% |
Coveware | IR caseload (mostly SMB/mid-market) | US$325k (Q4) | 20% (Q4) |
Sophos | 3,400 surveyed orgs, 17 countries, ransomware victims | US$1.0M | 49% paid and recovered |
The "correct" answer depends on the question. For a CISO asking "if we get hit and decide to pay, what is the central tendency?" Coveware's median and Sophos's median are the closest analogues. For a journalist or policymaker asking "how much money is flowing to ransomware actors as a system?" Chainalysis is the right cite.
Who is paying, and who is not
The data converges on one message: most victims now refuse. Stacking the 2025 datasets:
Chainalysis: 28% of victims paid (on-chain estimate, full year).
Coveware Q4 2025: 20% paid (all-impact, IR caseload).
Coveware Q3 2025: 23% paid (all-impact, IR caseload), 19% paid in exfiltration-only cases.
Sophos State of Ransomware 2025: 49% paid and got data back (survey; population has higher baseline pay intent).
IBM Cost of a Data Breach 2025: 63% of ransomware-hit organizations refused to pay, up from 59% in 2024.
Marsh US cyber claims (2024): 23% of clients hit by cyber extortion paid; 77% refused.
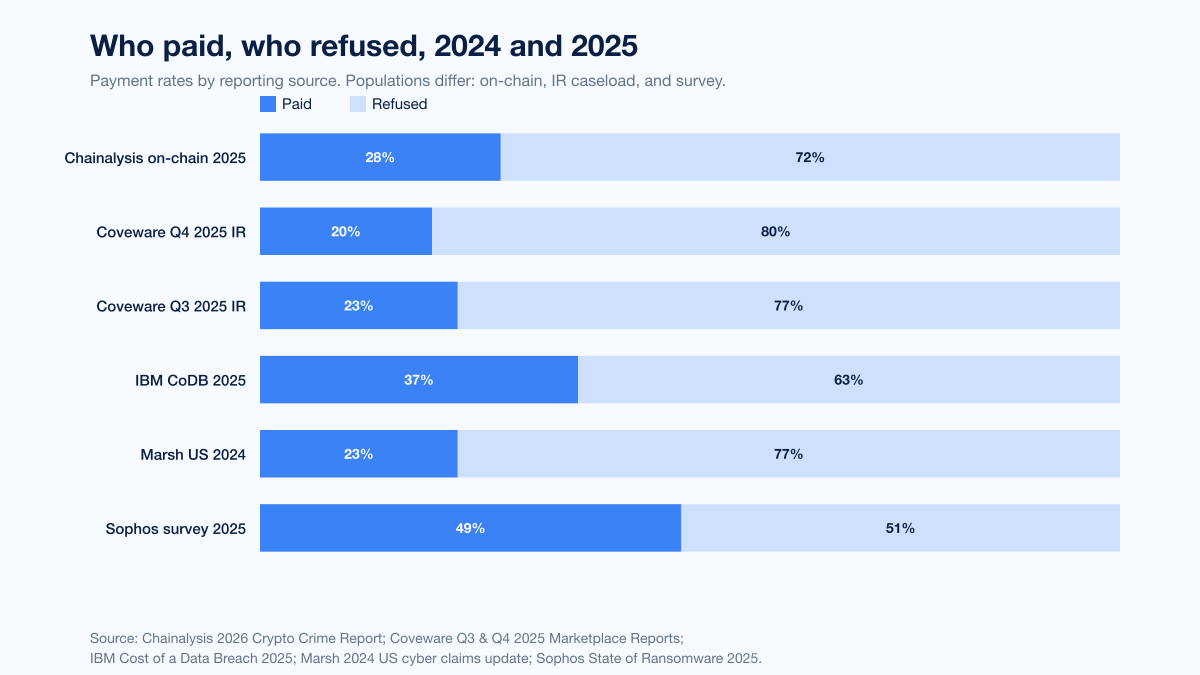
Figure 2: Share of ransomware victims who paid the ransom vs refused, by reporting source. Source: Chainalysis 2026 Crypto Crime Report; Coveware Q4 2025 Marketplace Report; Sophos State of Ransomware 2025; IBM Cost of a Data Breach 2025; Marsh 2024 cyber claims update.
Why payment rates collapsed
Four forces, none of them new but all reaching maturity in 2025:
Better backups. The number of organizations able to recover within a week jumped from 35% in 2024 to 53% in 2025, per Sophos. Immutable snapshots, off-site replication, and faster restore pipelines mean pure-encryption extortion has diminishing returns.
Insurance underwriting discipline. Marsh reports that 77% of US extortion-event clients refused to pay in 2024. Underwriters increasingly require proof of backup recovery, EDR, and MFA before bind; carriers are less willing to fund payments when a restore is feasible.
Law enforcement disruption. Operation Cronos reduced LockBit H2 2024 activity by roughly 79% per Chainalysis, ALPHV/BlackCat exit-scammed in January 2024, and the FBI reports having helped victims avoid over US$800M in payments through decryption-key distribution since 2022 (FBI IC3 2024 Annual Report).
Regulatory and reputational deterrence. OFAC sanctions guidance, state bans on public-sector payments, and SEC incident-disclosure rules push boards to document that payment was not the default response.
The recovery-cost trade-off
Sophos data puts the 2025 average recovery cost (excluding the ransom) at US$1.53M, down 44% from US$2.73M in 2024. IBM's Cost of a Data Breach 2025 pegs the all-in average cost of a ransomware/extortion incident at US$5.08M. The gap is consistent with better IR muscle: faster containment, more mature playbooks, and cheaper cloud-based restore means recovering without paying is operationally viable for most organizations, even if it is not painless.
Industries hit hardest
Two sources converge. Coveware Q4 2025 ranks its IR caseload by sector share, and the Verizon 2025 DBIR ranks ransomware growth by industry.
Industry | Coveware Q4 2025 share | Notes |
|---|---|---|
Professional services | 18.92% | Top sector for the third consecutive quarter; covers MSPs, law firms, accounting, consulting |
Healthcare | 15.32% | Hospitals, clinics, health-tech vendors; high urgency typically pushes above-average payment rates |
Technology hardware and equipment | 9.91% | OEMs, components, and vendor supply chain; exposure often via third-party software and MSP compromise |
Consumer services | 9.01% | Hospitality, travel, consumer platforms; high volumes of PII drive exfiltration leverage |
Software services | 7.21% | SaaS and packaged software vendors; downstream customer-data exposure raises notification liability |
Financial services | 6.31% | Banks, wealth managers, fintech; regulatory disclosure pressure shapes negotiation posture |
Retailing | 6.31% | Brick-and-mortar and e-commerce retailers; POS and e-commerce-platform compromise are recurring vectors |
Source: Coveware Q4 2025 Ransomware Marketplace Report.
Verizon reports ransomware attacks against manufacturing surged 61% in 2025 relative to 2024, making it the top-targeted global sector in the DBIR corpus. ENISA, looking only at EU incidents between July 2024 and June 2025, reports manufacturing led ransomware claims at 14.9% of the 4,875 incidents analyzed.
Small and mid-sized businesses take the hardest hit on per-breach involvement. Verizon's 2025 DBIR states that ransomware was present in 88% of SMB breaches versus 39% of large-enterprise breaches, meaning SMBs are nearly four times more likely to have ransomware as part of any breach they suffer.
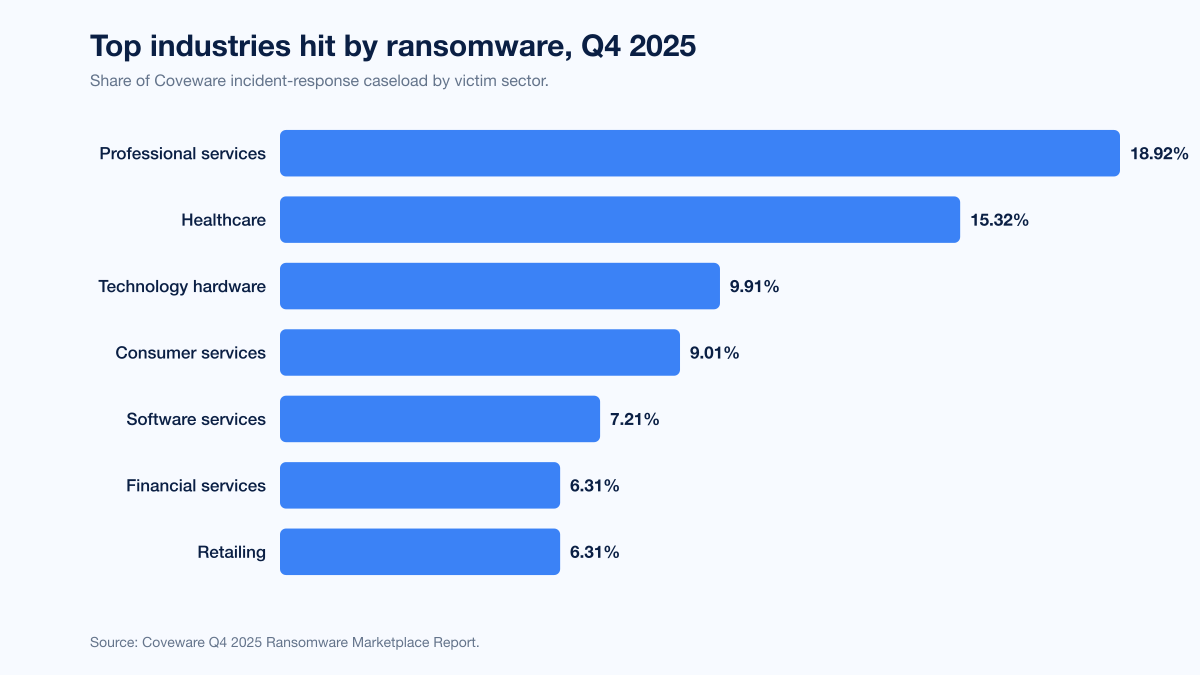
Figure 3: Coveware Q4 2025 ransomware victim industry distribution. Source: Coveware Q4 2025 Ransomware Marketplace Report.
Top ransomware groups of 2025 and 2026
Akira and Qilin dominated 2025 leak-site activity. The group mix varies modestly between Coveware (IR caseload weighted to mid-market), FBI IC3 (US complaints), NCC Group (leak-site tracking), and ENISA (EU visibility), but Akira tops three of the four rankings.
The two columns with complete data across the corpus are Coveware's Q4 2025 IR caseload rankings and the FBI IC3 2024 top-5 flag. We lead with those, then follow with prose coverage for NCC Group's December 2025 leak-site ranking and ENISA's EU share, where only a handful of top groups are disclosed publicly.
Group | Coveware Q4 2025 IR share | FBI IC3 2024 top 5 |
|---|---|---|
Akira | 14% (1st) | Top 5 |
Qilin | 13% (2nd) | Not in top 5 |
Lone Wolf | 12% (3rd) | Not in top 5 |
CL0P | 7% (4th) | Not in top 5 |
Silent Ransom | 6% (5th) | Not in top 5 |
Shiny Hunters | 4% (6th) | Not in top 5 |
LockBit | Mentions only | Top 5 |
RansomHub | Mentions only | Top 5 |
FOG | Not in Q4 top 6 | Top 5 |
PLAY | Mentions only | Top 5 |
Sources: Coveware Q4 2025; FBI IC3 2024 Annual Report.
NCC Group December 2025 leak-site ranking (top 2 disclosed): Qilin led with 172 attacks (22% share), Akira ranked 2nd with 80 attacks (NCC Group Monthly Threat Pulse December 2025). LockBit posting volumes remained depressed in the second half of 2025 relative to pre-Operation Cronos levels, consistent with the earlier 79% H2 2024 payment-revenue decline Chainalysis documented.
ENISA 2024-25 EU ransomware share (top 3 disclosed): Akira led at 11.6%, SafePay 2nd at 10.1%, Qilin 3rd at 7.5% (ENISA Threat Landscape 2025). SafePay's EU prominence contrasts with its lower visibility in the US FBI IC3 top 5, which illustrates why multi-source ranking is worth the effort.
What happened to the old giants
LockBit: Following Operation Cronos in February 2024, LockBit H2 2024 payments fell approximately 79% per Chainalysis. The group continues to post to its leak site, but many posts are repeats or unverified. It has not recovered to pre-disruption revenue levels in 2025.
ALPHV/BlackCat: Exit-scammed its affiliates in January 2024 after the Change Healthcare payout. Operators stopped posting and the group has not re-emerged under the same banner.
Cl0p: Continues to run mass-exploitation campaigns tied to zero-day vulnerabilities. Drove NCC Group's February 2025 spike (+460% MoM on Cl0p-attributed posts alone) after a new software zero-day.
RansomHub: Emerged in February 2024 as an affiliate-recruiting RaaS and climbed into the top five in FBI IC3 complaint data for 2024. Its 2025 trajectory is less dominant than its arrival suggested.
Qilin: The breakout group of 2025. Led NCC Group's leak-site rankings in June, September, and December 2025, and took 22% of December 2025 activity alone.
Monthly attack-count trend by top groups
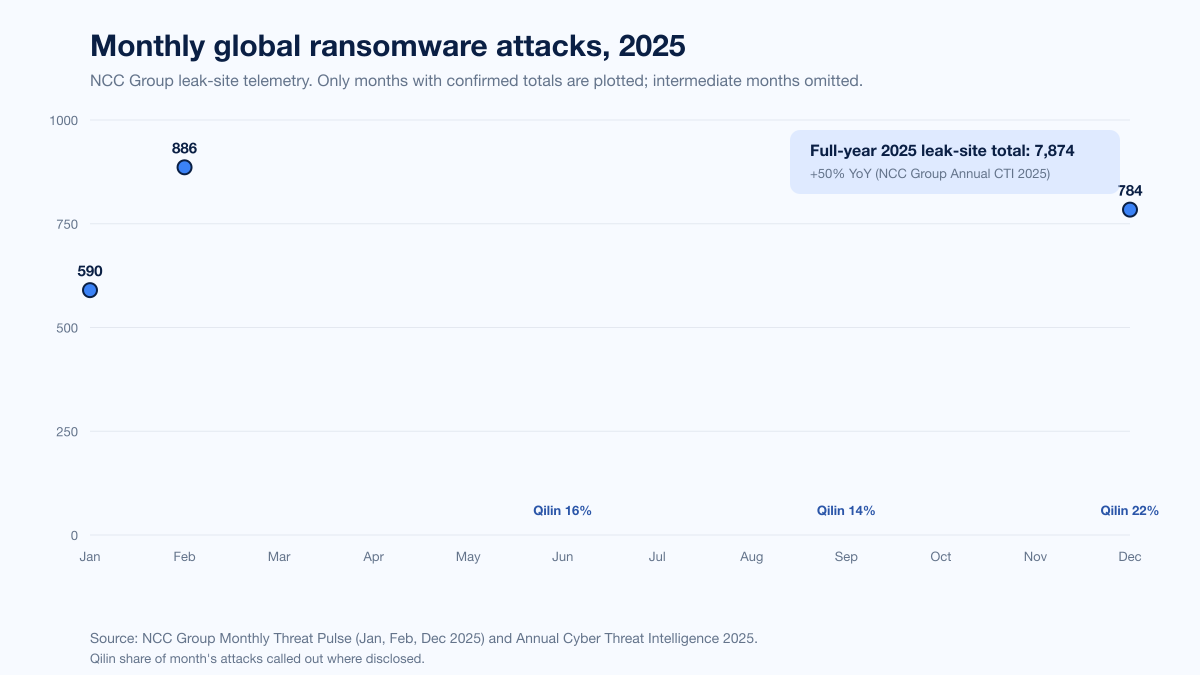
Figure 4: Monthly leak-site activity for top ransomware groups, 2025. Source: NCC Group Monthly Threat Pulse series, January through December 2025.
Payment methods and laundering trends
Ransomware payments remain overwhelmingly cryptocurrency-denominated. Chainalysis's 2026 Crypto Crime Report summary notes that stablecoins made up 84% of all illicit crypto transaction volume in 2025, though the ransomware-specific split between Bitcoin, privacy coins, and stablecoins was not enumerated at the report-introduction layer we verified.
Laundering pathways, per Chainalysis's earlier 2025 report:
Centralized exchanges received 39% of ransomware off-ramp volume in 2024, versus a 37% historical average.
Mixers declined well below the 10-15% historical band.
Cross-chain bridges increased, suggesting attackers are rotating between chains before cashing out.
Personal-wallet holding increased: operators are "abstaining from cashing out more than ever" per Chainalysis, which is consistent with sanctions pressure on known off-ramps.
The initial-access-broker market fed the ransomware pipeline for roughly US$14M in 2025 per Chainalysis, meaning downstream ransomware payments ran about 58 times the value flowing to IABs. Access prices have declined: Chainalysis tracked the average network-access listing at US$439 in Q1 2026, down from approximately US$1,400 in 2023. Lower access prices are consistent with an affiliate market flooded with supply from infostealer-logs and mass-exploit campaigns.
Regional breakdown
The three most-visible corpora give three similar pictures:
North America: 50% of all ransomware attacks tracked by NCC Group in December 2025 targeted North American organizations (392 of 784 incidents). US complaints to the FBI IC3 rose 9% YoY to 3,156 in 2024.
Europe: ENISA analyzed 4,875 EU cyber incidents between July 2024 and June 2025 and found ransomware made up 81.1% of them, by far the single largest category. Manufacturing (14.9%) and public administration (2.2%) led sectorally.
UK: Marsh reports UK ransomware claims fell 31% in 2024 versus 2023 but remained one-third higher than 2020-2022 levels, with negotiated reductions of more than 60% from initial demand when negotiators were involved.
Chainalysis names the top targeted jurisdictions for ransomware in 2025 as the United States, Canada, Germany, the United Kingdom, and wider Europe.
Dwell time and detection
Mandiant's M-Trends 2025 report places global median dwell time at 11 days in 2024, up from 10 in 2023 but a major improvement from the 205-day median recorded in 2014. Ransomware-related intrusions run tighter than the global average:
Detection source | Global median dwell | Ransomware-related median dwell |
|---|---|---|
External entity notified the victim | 26 days | 5 days |
Adversary notified the victim | 5 days | 5 days |
Victim discovered internally | 10 days | 29 days |
All sources combined | 11 days | 6 days |
Source: Mandiant M-Trends 2025.
Adversary-notified dwell time sitting at 5 days is the ransomware signature: by the time the victim learns of the intrusion, encryption or extortion has already fired. The 29-day internal-detection median for ransomware cases reflects the opposite: when victims catch the intrusion before the attacker reveals themselves, the attacker has already been inside for nearly a month. Either way, ransomware is the intrusion class with the tightest window between dwell and impact.
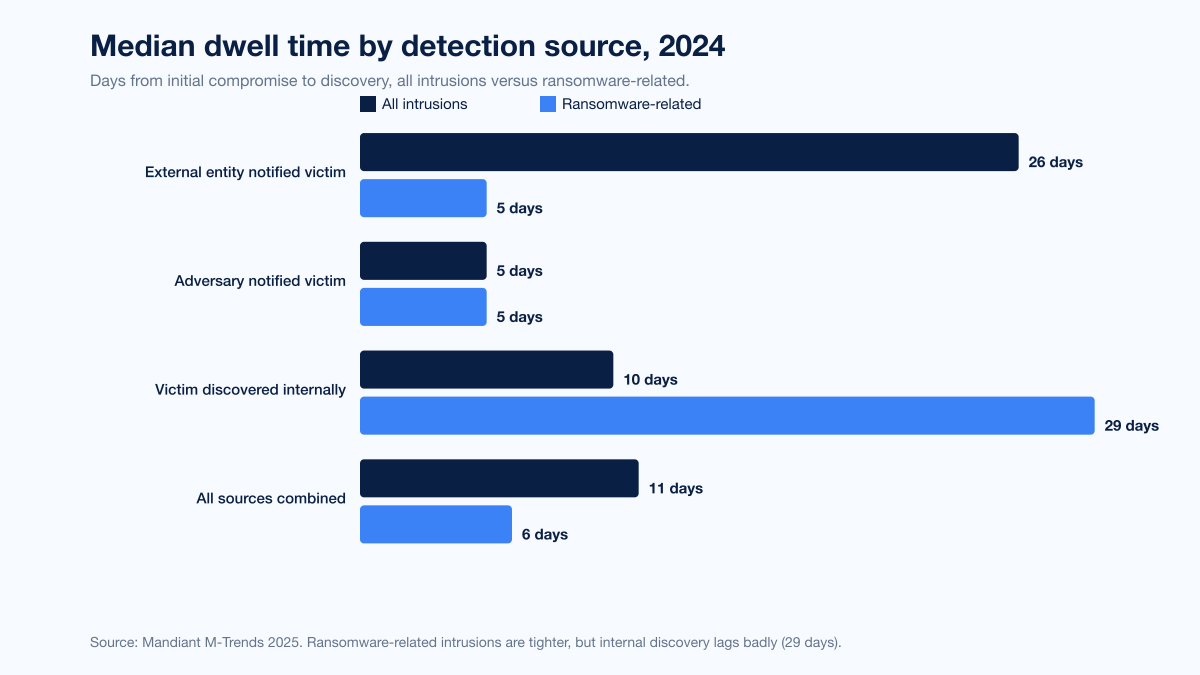
Figure 5: Global median dwell time by detection source, all intrusions vs ransomware-related. Source: Mandiant M-Trends 2025.
IBM's Cost of a Data Breach 2025 reports the average time to identify and contain any breach at 241 days, a nine-year low. Organizations using AI-driven detection and response extensively shortened the breach lifecycle by 80 days on average and saved nearly US$1.9M per incident.
The cyber-insurance impact on payouts
Carriers saw the trend before boards did. The Marsh 2024 cyber-claims update shows:
23% of Marsh clients hit by cyber extortion in 2024 paid a ransom. 77% refused.
UK ransomware claims fell 31% in 2024 relative to 2023, though 2023 was inflated by MOVEit.
In UK engagements involving ransomware-negotiator specialists, final payments were typically more than 60% below the initial demand.
Sophos's parallel dataset shows negotiation discipline at work globally: 53% of 2025 payers paid less than the initial ask, and 18% paid more (typically in cases where the victim missed a deadline or lost leverage through exfiltration disclosure).
Insurance is now a co-underwriter of security posture. Every major carrier asks for MFA everywhere, EDR with 24/7 response, immutable backups, privileged-access hygiene, and a documented IR plan as binder requirements. Organizations that cannot demonstrate these controls face exclusion riders on ransomware and extortion coverage, which in turn changes the payment calculus when an incident hits.
Largest publicly-tracked payouts
Year | Victim | Amount paid | Threat actor | Source |
|---|---|---|---|---|
2024 | Undisclosed Fortune 50 (widely reported as Cencora / AmerisourceBergen) | US$75M | Dark Angels | Zscaler ThreatLabz 2024 Ransomware Report; Chainalysis confirmed |
2024 | Change Healthcare | US$22M (~350 BTC) | ALPHV/BlackCat | UnitedHealth congressional testimony |
2023 | Caesars Entertainment | US$15M (negotiated from US$30M) | Scattered Spider / BlackCat affiliate | Caesars 8-K; CPO Magazine |
As of April 2026 we are not aware of a single publicly-disclosed 2025 ransom payment confirmed above the Dark Angels US$75M, but on-chain analytics suggest at least one 2025 incident cleared eight-figures of paid ransom. Coveware's Q2 2025 average of US$1.13M implies a handful of extreme tail payments skewing the mean substantially.
2026 year-to-date signals
Q1 2026 quarterly reports from Coveware and Chainalysis were not fully published as of this writing (April 22, 2026). Signals we do have:
NCC Group's monthly threat pulses through early 2026 show ransomware levels "steadily rose for the fourth consecutive month in December 2025" with Q1 2026 continuing at elevated leak-site-victim counts.
Chainalysis's 2026 Crypto Crime Report preview notes network-access listings averaging US$439 in Q1 2026, down sharply from 2023.
Mandiant's M-Trends 2026 report teaser flags "recovery denial" extortion tactics and handoff timelines collapsing to "seconds" between initial-access-broker sale and ransomware deployment as top 2026 themes.
We will update this post when Q1 2026 marketplace data lands from the primary sources.
What this means for defenders in 2026
Stingrai's research team sees the 2025 data as a confirmation that the "pay or die" framing is obsolete for well-prepared organizations, but the attack-volume trend punishes organizations without preparation.
Move off the 12-month pentest cadence. Attacker dwell time for ransomware is six days (Mandiant). If you test annually, your next test will miss 51 weeks of real-world posture drift. Stingrai's PTaaS platform runs continuous assessments with free retests after every code change, which is the cadence that matches attacker tempo.
Validate your IR runbook with realistic simulation. Sophos's "53% recovered within a week" figure is achievable only for organizations that have actually practiced restore-from-immutable-backup, isolate-and-reimage, and comms-with-carrier playbooks. Red team engagements covering ransomware kill-chains and tabletop exercises are the only way to confirm the runbook works before the attacker does.
Close the exploit-driven entry vectors. 32% of 2025 ransomware incidents started with an exploited vulnerability (Sophos). Internet-facing edge devices, VPN appliances, hypervisors, and SaaS integration points are the 2025-2026 attacker favorites. Track CISA KEV, prioritize patching based on exploitation evidence, and pentest your perimeter on every major release.
Invest in detection that fires inside the 5-day adversary-notification window. EDR, NDR, identity-threat detection, and SOC automation mean-time-to-detect has to hit hours, not weeks. IBM's data shows AI-driven detection cut breach lifecycles by 80 days on average.
Harden your web and application surface. Web application penetration testing catches the credential-leak and injection chains that initial-access brokers monetize into ransomware handoffs. The IAB market averaged US$439 per access in Q1 2026: if your app leaks credentials or allows account takeover, your future ransomware case is already on sale.
For Stingrai customers, our PTaaS platform, red team, and social engineering services target exactly the entry points the Sophos, Coveware, and Mandiant data identify as the 2025-2026 ransomware superhighway. See our case studies for concrete examples of how continuous pentesting prevents ransomware handoffs at the initial-access stage.
Frequently asked questions
What is the average ransomware payment in 2026?
There are two commonly cited figures. Chainalysis's on-chain dataset puts the median paid ransom at US$59,556 for 2025, up 368% year over year. Sophos's State of Ransomware 2025 survey of 3,400 organizations puts the median paid ransom at US$1.0M, down from US$1.26M the year before. Coveware's Q4 2025 incident-response caseload shows an average of US$591,988 and a median of US$325,000 (Coveware). The right figure depends on whether you want the distribution center for real-world IR cases (Sophos or Coveware median) or the system-wide total (Chainalysis).
What percentage of ransomware victims pay in 2026?
Chainalysis estimates 28% of victims paid in 2025 on an on-chain basis, a record low (Chainalysis 2026 Crypto Crime Report). Coveware measured 20% in Q4 2025, the lowest rate it has ever reported (Coveware). IBM's Cost of a Data Breach 2025 reports 63% of ransomware-hit organizations refused to pay, up from 59% in 2024 (IBM).
Has ransomware gotten worse or better in 2026?
Both. Attack volume rose 50% year over year to a record 7,874 leak-site victims in 2025 per NCC Group's Annual Cyber Threat Intelligence 2025. On-chain payments fell 8% to roughly US$820M per Chainalysis. Payment rates dropped to 20-28% depending on source. More victims are being hit, fewer pay, and the ones who pay tend to pay more.
Which industry is hit most by ransomware in 2026?
Manufacturing leads globally per the Verizon 2025 DBIR, which found ransomware attacks against manufacturing rose 61% year over year. In Coveware's Q4 2025 IR caseload, professional services is the top sector at 18.92% with healthcare second at 15.32% (Coveware Q4 2025). In the EU, ENISA places manufacturing first at 14.9% of ransomware claims between July 2024 and June 2025 (ENISA Threat Landscape 2025).
What is the largest ransomware payment of 2024 or 2025?
The largest confirmed ransom payment to date is US$75M, paid in 2024 by an undisclosed Fortune 50 victim to the Dark Angels group, per the Zscaler ThreatLabz 2024 Ransomware Report and confirmed on-chain by Chainalysis. Change Healthcare paid ALPHV/BlackCat US$22M (approximately 350 BTC) in March 2024. No single 2025 payment publicly exceeded the Dark Angels figure as of April 2026.
Is it legal to pay a ransomware demand?
In most US jurisdictions, paying is legal but exposure to OFAC sanctions risk means it requires careful legal and law-enforcement coordination. Paying a sanctioned entity is illegal; several prolific ransomware groups and affiliated wallets are on the OFAC SDN list. Multiple US states, including North Carolina and Florida, prohibit public-sector entities from paying. EU jurisdictions are moving toward tighter disclosure and reporting rules under NIS2. Any payment decision should involve outside counsel and FBI coordination before wires move.
Does cyber insurance cover ransomware payments?
Most cyber policies still cover ransom payments, but coverage has tightened. Marsh reports 23% of US clients hit by cyber extortion in 2024 paid, with carriers often requiring MFA, EDR, immutable backups, and documented IR plans as binder conditions (Marsh 2024 cyber claims update). Some markets now exclude payments to sanctioned entities, and several carriers impose sub-limits on cyber-extortion coverage separate from the overall policy aggregate.
What ransomware groups are most active in 2026?
Qilin was the most active group globally in late 2025, accounting for 22% of December 2025 leak-site posts per NCC Group. Akira remains consistently in the top two across Coveware, NCC Group, and ENISA datasets. Cl0p drives periodic spikes tied to zero-day exploitation campaigns. RansomHub, Lone Wolf, SafePay, Silent Ransom, and Shiny Hunters round out the 2025 top tier depending on the corpus.
How long does it take to recover from a ransomware attack?
Fifty-three percent of Sophos 2025 respondents fully recovered within a week, up from 35% in 2024 (Sophos State of Ransomware 2025). Only 18% took more than a month. The average recovery cost excluding ransom payment was US$1.53M in 2025, down 44% from US$2.73M in 2024. IBM's Cost of a Data Breach 2025 puts the average time to identify and contain any breach at 241 days.
Should companies pay ransomware demands?
There is no universal answer, but the data trend is clearly against paying. 63% of IBM-surveyed ransomware victims refused to pay in 2025, up from 59% in 2024, and 97% of Sophos respondents with encrypted data recovered it whether they paid or not. Paying funds future attacks, does not guarantee recovery, risks OFAC sanctions exposure, and sets a precedent. That said, specific cases (life-safety, public-safety, or zero-backup scenarios) can justify paying. The decision should involve legal, law-enforcement, and negotiation specialists.
How can organizations prevent ransomware?
Close the top three 2025 initial-access vectors (exploited vulnerabilities at 32%, compromised credentials at 23%, malicious emails at 19% per Sophos). Enforce MFA everywhere, particularly on VPN and identity-provider access. Patch internet-facing edge devices on 30-day SLAs at most. Deploy EDR with 24/7 response. Maintain immutable backups with tested restore procedures. Run tabletop exercises quarterly. Test your perimeter and application security continuously via PTaaS and red team engagements. See our guide to penetration testing methodologies for how to choose the right test type for your environment.
References
Chainalysis. Crypto Ransomware: 2026 Crypto Crime Report preview. February 2026. https://www.chainalysis.com/blog/crypto-ransomware-2026/. On-chain analysis of 2025 ransomware flows, including total victim payments, median payment, payment rates, and initial-access-broker market data.
Chainalysis. Crypto Ransomware 2025: 35.82% YoY Decrease in Ransomware Payments. February 2025. https://www.chainalysis.com/blog/crypto-crime-ransomware-victim-extortion-2025/. Initial on-chain analysis for 2024 ransomware flows; 2024 figure was later revised upward in the 2026 report.
Chainalysis. 2026 Crypto Crime Report Introduction. February 2026. https://www.chainalysis.com/blog/2026-crypto-crime-report-introduction/. Full-year 2025 illicit crypto totals, stablecoin share, nation-state trends.
Coveware. Mass Data Exfiltration Campaigns Lose Their Edge in Q4 2025. February 3, 2026. https://www.coveware.com/blog/2026/2/3/mass-data-exfiltration-campaigns-lose-their-edge-in-q4-2025. Q4 2025 average and median payments, payment rate, top variants, sector share, initial-access vectors.
Coveware. Insider Threats Loom while Ransom Payment Rates Plummet (Q3 2025). October 24, 2025. https://www.coveware.com/blog/2025/10/24/insider-threats-loom-while-ransom-payment-rates-plummet. Q3 2025 average and median payments, record-low 23% payment rate.
Coveware. Ransomware Quarterly Reports Index. 2025. https://www.coveware.com/ransomware-quarterly-reports. Listing of all quarterly marketplace reports with publication dates.
Sophos. State of Ransomware 2025. June 2025. https://www.sophos.com/en-us/blog/the-state-of-ransomware-2025. Global survey of 3,400 IT and cybersecurity leaders in 17 countries; median ransom, recovery cost, root causes, sector breakdowns.
Sophos. State of Ransomware 2025 landing page. 2025. https://www.sophos.com/en-us/content/state-of-ransomware. Summary figures including average ransom payment and recovery cost.
Verizon. 2025 Data Breach Investigations Report. April 23, 2025. https://www.verizon.com/business/resources/reports/dbir/. 12,195 breaches analyzed between November 2023 and October 2024; ransomware share of breaches, SMB vs enterprise data, manufacturing targeting.
Mandiant (Google Cloud). M-Trends 2025: Data, Insights, and Recommendations From the Frontlines. April 2025. https://cloud.google.com/blog/topics/threat-intelligence/m-trends-2025. Global median dwell time, ransomware-specific dwell time, initial-access vectors, sector targeting.
IBM. Cost of a Data Breach Report 2025. July 2025. https://www.ibm.com/reports/data-breach. Global average breach cost, average ransomware incident cost, payment refusal rates, AI-driven detection impact.
FBI Internet Crime Complaint Center. 2024 Internet Crime Report. May 2025. https://www.ic3.gov/AnnualReport/Reports/2024_IC3Report.pdf. US complaint data, ransomware complaint counts, top variants, critical-infrastructure targeting.
ENISA. ENISA Threat Landscape 2025. October 2025. https://www.enisa.europa.eu/sites/default/files/2025-11/ENISA%20Threat%20Landscape%202025.pdf. 4,875 EU cyber incidents analyzed from July 2024 to June 2025; ransomware share, variant breakdown, sector breakdown.
NCC Group. Annual Cyber Threat Intelligence 2025. March 2026. https://www.nccgroup.com/newsroom/ncc-group-annual-cyber-threat-intelligence-2025/. Full-year 2025 leak-site-victim count, YoY growth, sector and regional breakdowns.
NCC Group. Monthly Threat Pulse, December 2025. January 2026. https://www.nccgroup.com/newsroom/ncc-group-monthly-threat-pulse-review-of-december-2025/. December 2025 attack counts by group, sector, and region.
Marsh. Ransomware: A Persistent Challenge in Cyber Insurance Claims. June 2024. https://www.marsh.com/en/services/cyber-risk/insights/ransomware-a-persistent-challenge-in-cyber-insurance-claims.html. US and Canada cyber-extortion client data, payment rates, sector breakdowns.
Marsh. UK Cyber Insurance Claims in 2024. May 2025. https://www.marsh.com/en-gb/about/media/uk-cyber-insurance-claims-2024.html. UK ransomware claims YoY, negotiated-demand-reduction rates.
Zscaler ThreatLabz. 2024 Ransomware Report. July 2024. https://www.zscaler.com/press/zscaler-s-annual-ransomware-report-uncovers-record-breaking-ransom-payment-us-75-million. Discovery of the record US$75M Dark Angels payout by a Fortune 50 victim.
The Record (Recorded Future News). Ransomware payments dropped in 2025 as attack numbers reached record levels: Chainalysis. 2026. https://therecord.media/ransomware-payments-chainalysis-cybercrime. Independent summary of Chainalysis 2026 Crypto Crime Report preview numbers.
Blocks and Files. Average ransomware payment now US$1.1M: Coveware charts rise of data exfiltration. August 13, 2025. https://blocksandfiles.com/2025/08/13/coveware-charts-rise-of-data-exfiltration/. Summary of Coveware Q2 2025 marketplace report figures.
Want to see how your environment holds up against the 2025-2026 ransomware kill chain before it hits you? Our continuous PTaaS platform and red team engagements specifically target the initial-access vectors behind this year's payouts. Get in touch.