




The average organization alerts on just 1 in 7 simulated attacks. Across more than 160 million breach and attack simulations, only 14% generated a security alert, per the Picus Blue Report 2025. Prevention held up better at 62%, but data exfiltration was blocked in only 3% of attempts, down from 9% a year earlier. Meanwhile, once an intruder is actually inside, the global median dwell time climbed to 14 days in 2025, up from 11, according to Mandiant M-Trends 2026. Adversaries are getting in, staying quiet, and moving faster than most detection programs can keep up with.
Three forces define detection outcomes in 2026. First, attackers now hand off access to a second crew in a median of 22 seconds after the initial compromise, collapsing from more than 8 hours in 2022 (Mandiant M-Trends 2026). Second, eCrime intruders reach lateral movement in a median of 29 minutes, a 65% increase in speed year over year (CrowdStrike 2026 Global Threat Report). Third, malware has gone quiet on purpose: 80% of the top ten MITRE ATT&CK techniques now serve evasion, persistence, and command and control, and process injection alone appears in 30% of samples (Picus Red Report 2026). This is the environment CISOs, security buyers, and boards are trying to benchmark.
This post is the Stingrai research team's canonical 2026 reference for red team detection and response benchmarks. It carries a single canonical benchmark table plus three original charts, built from five primary publishers: Picus Security, Mandiant (Google Cloud), CrowdStrike, IBM, and Verizon. Lead data is full-year 2025 telemetry and first-half 2025 simulation data, the freshest available; the primary publishers have not yet released full-year 2026 editions as of July 2026, and the next Picus Blue Report is expected around September 2026. Every figure carries its source, edition, and what it actually measures, so any claim can be audited inline.
What percentage of attacks do SOCs actually detect, and would mine catch a red team?
The direct answer: the average organization generates a security alert on about 14% of tested attack actions, roughly 1 in 7, and prevents 62% of them outright, per the Picus Blue Report 2025. But that number comes from breach and attack simulation, a lab-style test of your security controls, not a live measurement of whether your SOC would catch a human adversary who adapts to what your team does and does not see.
That distinction is the whole point of this post. A control-effectiveness score tells you how your tooling handles a catalog of known adversary actions. A red team tells you how your people, process, and tooling perform together against an operator who is actively trying to stay under your detection threshold. The benchmarks below set realistic expectations for both, so you can walk into a red team debrief, or a budget conversation, knowing what average looks like and where you actually stand.
Key statistics at a glance
Alert rate (2025): 14% of simulated attacks generated an alert, roughly 1 in 7 (Picus Blue Report 2025).
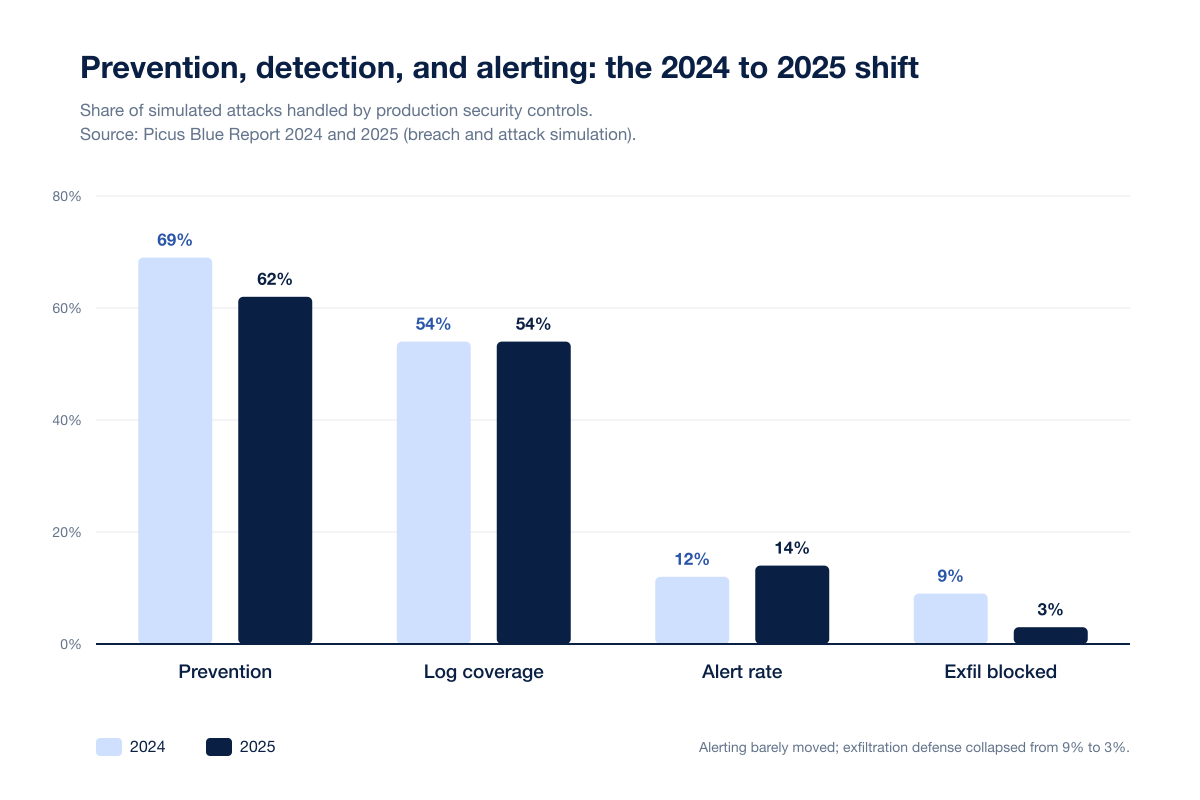
Prevention rate (2025): 62% of simulated attacks blocked, down from 69% in 2024 (Picus Blue Report 2025).
Data exfiltration blocked (2025): 3%, down from 9% in 2024 (Picus Blue Report 2025).
Global median dwell time (2025): 14 days, up from 11 in 2024 (Mandiant M-Trends 2026).
Access handoff to a second crew (2025): a median of 22 seconds, from more than 8 hours in 2022 (Mandiant M-Trends 2026).
eCrime breakout time (2025): 29 minutes to first lateral movement, 65% faster year over year (CrowdStrike 2026 Global Threat Report).
Fastest breakout on record: 27 seconds (CrowdStrike 2026 Global Threat Report).
Intrusions detected internally (2025): 52%, up from 43% in 2024 (Mandiant M-Trends 2026).
Top malware technique (2025): process injection at 30% of samples, first place for the third year running (Picus Red Report 2026).
Ransomware presence in breaches: 44%, up from 32% (Verizon 2025 DBIR).
Key takeaways
Prevention is not detection, and the two are drifting apart. Controls prevented 62% of simulated attacks in 2025 but alerted on only 14%, per the Picus Blue Report 2025. A high prevention score can hide a detection program that goes silent the moment prevention fails, which is exactly the condition a red team exploits.
Getting caught is not the same as getting caught in time. Median dwell time worsened to 14 days in 2025 (Mandiant M-Trends 2026), while attackers reach lateral movement in a median of 29 minutes (CrowdStrike 2026 Global Threat Report). The gap between how fast adversaries move and how long defenders take to notice is the real benchmark, and it is widening.
Internal detection is the lever that actually moves dwell time. For the first time, more than half of intrusions, 52%, were caught by the victim's own team in 2025, up from 43% (Mandiant M-Trends 2026). Self-detected intrusions had a median dwell of about 9 days versus 25 days when an outside party made the call. Detection engineering pays for itself in dwell time.
Malware went quiet to beat detection, not to beat prevention. Evasion, persistence, and command and control now account for 80% of the top ten ATT&CK techniques, and destructive encryption fell 38% as actors chose silent residency (Picus Red Report 2026). Detection content tuned for noisy ransomware misses the quiet operator living off valid accounts.
A benchmark is not your number. Every figure here is a population-wide average from a specific measurement method. Your detection outcome depends on your telemetry coverage, your detection content, and your responders under pressure. A threat-led red team is the only way to measure it end to end.
Methodology: what each dataset actually measures
The credibility of a benchmark roundup lives in not conflating datasets that measure different things with different methods. Four measurement approaches feed this post, and each answers a different question.
Breach and attack simulation (Picus Blue Report 2025). Picus runs a catalog of known adversary actions against live production controls, then records whether each action was prevented, logged, or alerted on. This is a control-effectiveness test. The 14% alert rate means 14% of simulated actions raised an alert, drawn from more than 160 million simulations run in the first half of 2025. It does not mean SOCs catch 14% of real breaches.
Incident response engagements (Mandiant M-Trends 2026). Mandiant reports dwell time, detection source, and attacker behavior from actual intrusions it investigated during 2025, across more than 500,000 hours of frontline response. This population skews toward organizations that were breached seriously enough to call in incident responders, so it is a view of what happens when detection has already been tested by a real adversary.
Adversary telemetry (CrowdStrike 2026 Global Threat Report). CrowdStrike derives breakout time from interactive intrusions observed across its platform and intelligence during 2025. Breakout time is the interval between initial access and the first lateral movement inside the victim network.
Full breach lifecycle survey (IBM Cost of a Data Breach 2025). IBM, via Ponemon, surveys breached organizations and reports a mean time to identify and contain of 241 days, the lowest in nine years, alongside a global average breach cost of US$4.44M. This 241-day figure is a mean covering the entire lifecycle, identify plus contain, and is a different metric and a different population from Mandiant's 14-day median dwell. The two are not interchangeable, and summing or averaging across them produces nonsense.
Corroborating context comes from the Verizon 2025 DBIR, which analyzes a large corpus of confirmed breaches and reports that ransomware appeared in 44% of them and that 60% involved a human element. Every stat below is tagged with which of these methods produced it. Any figure that could not be traced to a named primary source on at least one verification pass was dropped rather than estimated.
The 2026 red team detection benchmark
This is the canonical table. Each row names the metric, the value, what it measures, and the exact source edition. Rows 9 and 10 are the ones most often confused: the 22 second figure is a handoff between two attacker groups, while the 29 minute figure is the attacker's own movement inside your network. They are not the same clock.
Metric | 2025 benchmark | What it measures | Source (edition) |
|---|---|---|---|
Prevention rate | 62% (was 69% in 2024) | Share of simulated attacks blocked by controls | Picus Blue Report 2025 (BAS) |
Alert rate | 14%, about 1 in 7 (was 12% in 2024) | Share of simulated attacks that generated an alert | Picus Blue Report 2025 (BAS) |
Detection log coverage | 54% (steady) | Share of simulated attacks that were logged | Picus Blue Report 2025 (BAS) |
Data exfiltration blocked | 3% (was 9% in 2024) | Share of data theft simulations prevented | Picus Blue Report 2025 (BAS) |
Global median dwell time | 14 days (was 11 in 2024) | Median days an intruder is present before detection | Mandiant M-Trends 2026 (IR) |
Intrusions detected internally | 52% (was 43% in 2024) | Share found by the victim's own team | Mandiant M-Trends 2026 (IR) |
Median dwell, internal detection | About 9 days | Dwell when the victim self-detects | Mandiant M-Trends 2026 (IR) |
Median dwell, external notification | 25 days (was 11 in 2024) | Dwell when a third party notifies you | Mandiant M-Trends 2026 (IR) |
Access handoff to a second crew | 22 seconds (from over 8 hours in 2022) | Median time from initial access to handoff to a secondary group | Mandiant M-Trends 2026 (IR) |
eCrime breakout time | 29 minutes (65% faster year over year) | Median time from initial access to first lateral movement | CrowdStrike 2026 GTR |
Fastest observed breakout | 27 seconds | Fastest recorded initial access to lateral movement | CrowdStrike 2026 GTR |
Prevention versus detection versus alerting
The Picus numbers reward a close read, because they separate three things that security teams often collapse into one. A control can prevent an action, it can log an action, and it can alert a human about an action. These are different capabilities, and in 2025 they moved in different directions.
Prevention slipped from 69% to 62%. Logging held steady at 54%, meaning nearly half of simulated attacks were never recorded at all. And alerting sat at 14%, so even among the attacks that were logged, most never surfaced to an analyst. The most striking decline was data exfiltration defense, which fell from 9% to 3%: when an attacker reaches the stage of moving data out, controls stopped it in only 3 in 100 attempts. Password resilience told a similar story, with at least one password hash cracked in 46% of tested environments, roughly double the prior year.
The reason detection lags prevention is structural. Logging gaps, misconfigured or missing detection rules, and integration problems between tools all sit between a logged event and a fired alert. Picus attributes the largest share of detection rule failures to log collection issues. This is why a red team that trips no prevention control can still operate for days without generating an alert: the telemetry either was not collected, or was collected but never turned into a detection.
There is a second-order effect worth naming. Attackers have optimized for exactly this gap. According to the Picus Red Report 2026, 80% of the top ten ATT&CK techniques now serve evasion, persistence, and command and control, and Credentials from Password Stores appears in roughly 1 in 4 samples. Adversaries are stealing valid credentials and blending into legitimate activity rather than tripping loud, well-signatured behaviors. A detection program built around yesterday's noisy ransomware will not see a quiet operator using valid accounts, a technique that hit a 98% success rate in Picus simulations.
Dwell time and who actually finds the intruder
Dwell time is the benchmark boards understand instinctively: how long was the intruder inside before anyone noticed. In 2025 the global median rose to 14 days, reversing several years of improvement. But the headline median hides the more useful story, which is who did the finding.
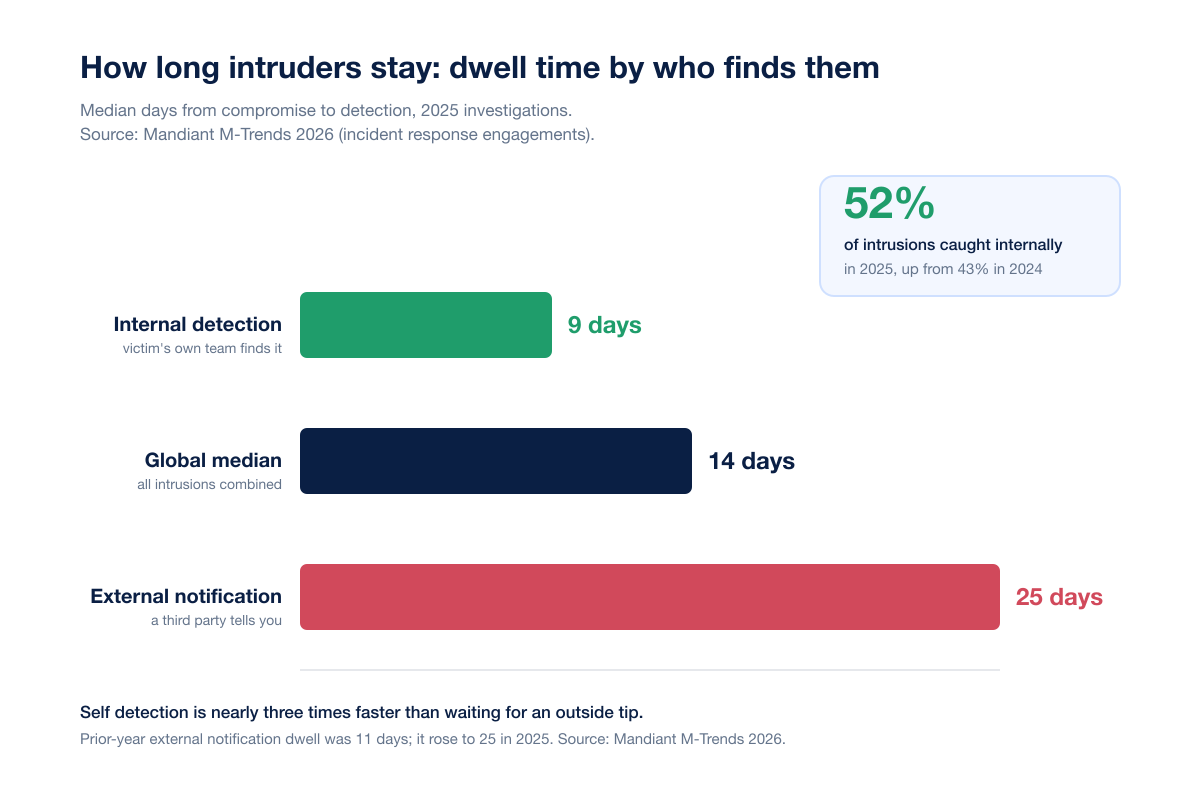
When an organization's own team caught the intrusion, median dwell was about 9 days. When a third party had to make the call, whether a law enforcement agency, a security vendor, or a partner, median dwell stretched to 25 days, up sharply from 11 the year before. The good news is that internal detection crossed a threshold in 2025: for the first time, more than half of intrusions, 52%, were found internally, up from 43%. That shift is the single most controllable lever on dwell time, and it is a direct product of detection engineering, log coverage, and a SOC that is practiced at running down its own alerts.
It is worth holding this next to the IBM Cost of a Data Breach 2025 figure of 241 days to identify and contain a breach. The two numbers are not in conflict, they measure different things. Mandiant's 14 days is a median time to detection drawn from investigated intrusions. IBM's 241 days is a mean covering the full lifecycle, from first evidence to full containment, self-reported by a broad survey population. A red team debrief should reference the detection benchmark, not the lifecycle mean, when it sets expectations for how quickly your team should have noticed.
Attacker speed: the 22 second handoff and the 29 minute breakout
Two figures from 2025 capture how compressed the attack timeline has become, and they are routinely misquoted as the same statistic. They are not.
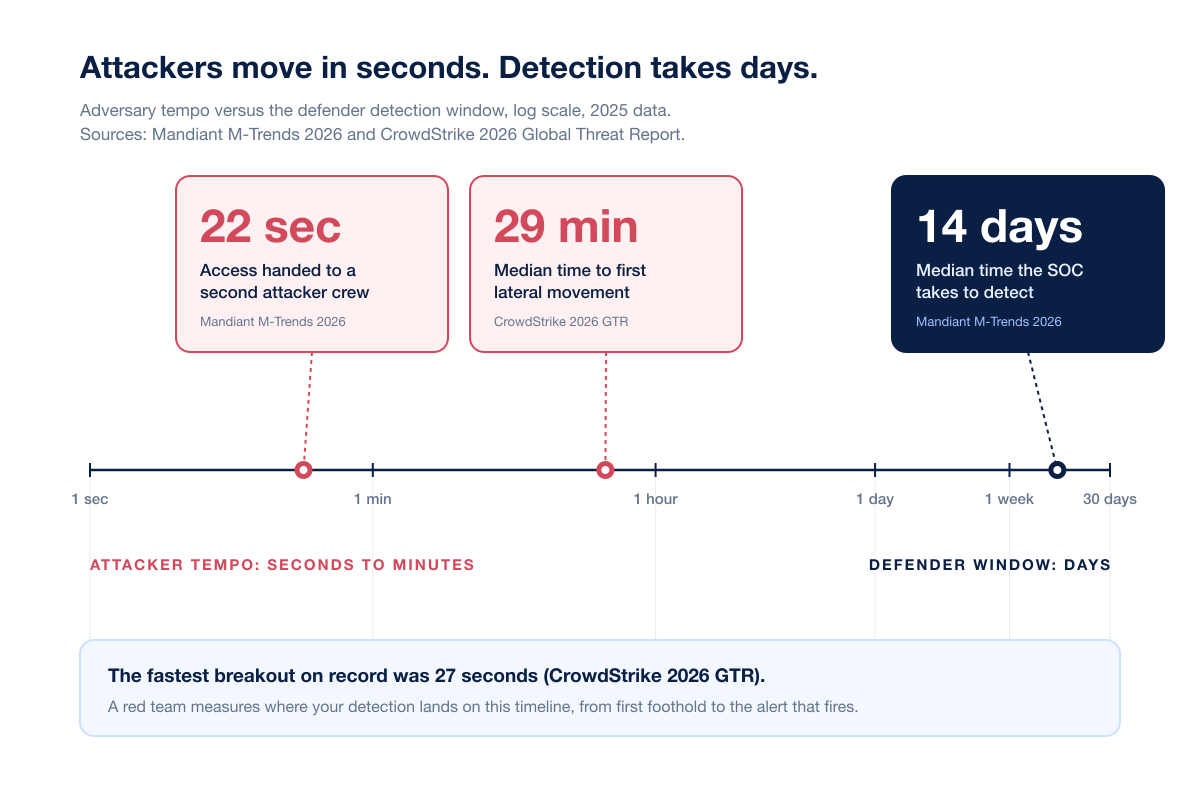
The 22 second figure is a handoff between two different attacker groups. Mandiant found that the median time from an initial access event to the moment access was handed to a secondary threat group fell to 22 seconds in 2025, from more than 8 hours in 2022. The mechanism is a division of labor: initial access brokers pre-stage the follow-on group's tooling during the first infection, so the second crew can begin operating almost the instant the door opens. This pattern appeared in 9% of 2025 investigations, up from 4% in 2022.
The 29 minute figure is different. That is CrowdStrike's median eCrime breakout time, the interval between initial access and the intruder's first lateral movement inside the victim network. It fell from a prior-year average of 48 minutes, a 65% increase in speed, and the fastest breakout CrowdStrike has ever recorded was 27 seconds. Breakout time is about how quickly a single actor spreads inside your environment; the 22 second handoff is about how quickly access is passed between actors. One measures movement, the other measures a transaction.
Put both against the 14 day median dwell time and the benchmark becomes stark. Adversaries transact access in seconds and reach lateral movement in minutes, while the median defender needs two weeks to detect anything at all. That is not a tooling problem alone. It is a detection-and-response problem, and it is precisely the window a red team is designed to measure.
What a realistic red team detection outcome looks like
The benchmarks set expectations, but they cannot tell you your number. Across Stingrai red team and assumed breach engagements, a few qualitative patterns recur often enough to be worth naming, without inventing precise percentages that would only mislead.
First foothold rarely fires an alert. Initial access through a valid account, a targeted phishing pretext, or an exposed service typically lands quietly. This mirrors the Picus finding that logging, not just alerting, is the earliest point of failure.
The loudest moment is usually lateral movement or privilege escalation, not initial access. When an alert does fire, it tends to fire well after the operator has established a foothold, consistent with the industry pattern of dwell measured in days.
Detection quality varies more than detection coverage. Many teams have the log source that would have caught an action, but no detection content mapped to it, or an alert that fired into a queue nobody triaged in time. The gap between a logged event and a human response is where most engagements are won.
The debrief is where the value compounds. The point of the exercise is not a pass or fail grade. It is a per-stage map of where telemetry was missing, where a rule should exist, and where response broke down, so the next iteration closes the gap.
The honest framing for a board is this: the average organization alerts on roughly 1 in 7 tested attacks, and a threat-led red team tells you your real number, stage by stage. That is a more useful figure to budget against than any industry median.
What this means for defenders
Benchmark detection, not just prevention. A 62% prevention score can coexist with a 14% alert rate. Ask your BAS or red team provider to report prevented, logged, and alerted separately, because a single blended score hides the exact failure a real adversary will find. See red team versus penetration test versus continuous validation for how these assessment types differ.
Invest in internal detection, because it is the lever that moves dwell time. The organizations that self-detect cut median dwell from 25 days to about 9. Prioritize log coverage on the identity, endpoint, and lateral-movement paths a red team will actually use, then write and test detection content against them.
Tune for the quiet operator, not just noisy ransomware. With 80% of top techniques serving evasion and persistence, and valid-account abuse near a 98% simulated success rate, detection content should cover living off the land techniques and LOLBins and EDR evasion, not only signatured malware.
Assume the timeline is compressed. With breakout in a median of 29 minutes, response playbooks that assume hours of runway are already behind. Rehearse containment against a minutes-not-hours clock.
Run the exercise more than once a year. A single annual test is a snapshot of a moving target. A continuous red teaming cadence, paired with PTaaS retesting to validate that fixes actually closed the detection gap, keeps the benchmark honest as your environment and the threat landscape change.
A living benchmark
These figures move every year, and this post is built to move with them. We will refresh the canonical table when the next primary editions land, beginning with the Picus Blue Report expected around September 2026, followed by the next Mandiant M-Trends and CrowdStrike Global Threat Report editions in early 2027. Until then, the 2025 data above is the freshest full-cycle telemetry available, and every value is traceable to the primary publisher named beside it.
Frequently Asked Questions
What percentage of attacks do SOCs actually detect in 2026?
The average organization generates an alert on about 14% of simulated attacks, roughly 1 in 7, and prevents 62% of them, according to the Picus Blue Report 2025, which analyzed more than 160 million breach and attack simulations. That alert rate is a control-effectiveness measurement, not a live measure of whether a SOC would catch a human adversary, which is what a red team assesses.
How often are red teams detected?
There is no single industry rate, because detection depends on your telemetry, detection content, and responders. As a baseline, controls alert on only 14% of tested attack actions (Picus Blue Report 2025) and median dwell time is 14 days (Mandiant M-Trends 2026), so a skilled operator often establishes a foothold without an alert. A threat-led red team reports detection stage by stage so you learn your own number.
What is the average time to detect a breach in 2026?
The global median dwell time, meaning the time an intruder is present before detection, was 14 days in 2025, up from 11, per Mandiant M-Trends 2026. Separately, IBM's Cost of a Data Breach 2025 reports a mean of 241 days to identify and contain a breach, which measures the full lifecycle rather than time to detection, so the two figures are not interchangeable.
What is a good SOC detection rate benchmark?
Against breach and attack simulation, the 2025 population averages are 62% prevention, 54% logging coverage, and 14% alerting (Picus Blue Report 2025). A mature program should aim to beat the alerting average by a wide margin and to detect internally rather than wait for outside notification, since internal detection cut median dwell from 25 days to about 9 (Mandiant M-Trends 2026).
Why do prevention and detection rates differ so much?
Prevention and detection are separate capabilities. In 2025, controls prevented 62% of simulated attacks but alerted on only 14% (Picus Blue Report 2025). The gap comes from missing log coverage, detection rules that are absent or misconfigured, and tools that do not integrate, so a logged event never becomes an alert. A red team exploits exactly this gap by operating without tripping prevention.
What is breakout time, and how is it different from the 22 second handoff figure?
Breakout time is the median interval between initial access and an intruder's first lateral movement inside your network, which was 29 minutes in 2025 (CrowdStrike 2026 Global Threat Report). The 22 second figure is different: it is the median time for an initial access broker to hand access to a secondary attacker group, per Mandiant M-Trends 2026. One measures a single actor moving; the other measures access passing between actors.
Does a low alert rate mean my SOC is bad?
Not necessarily, but it is a signal to investigate. A 14% population-average alert rate reflects industry-wide gaps in logging and detection content, not just analyst skill (Picus Blue Report 2025). The more useful question is whether you can detect internally and quickly. A red team or continuous validation exercise shows you which stages you see and which you miss.
How is red team detection different from a breach and attack simulation score?
Breach and attack simulation runs a catalog of known actions against your controls and scores prevention, logging, and alerting, which is how the 14% and 62% figures are produced (Picus Blue Report 2025). A red team is a human adversary who adapts to your defenses, chains techniques, and tests people and process, not just tooling. BAS measures control coverage at scale; a red team measures whether you would actually catch and stop an operator.
How can we improve our detection and response outcomes?
Prioritize log coverage and detection content on the identity, endpoint, and lateral-movement paths adversaries use, since logging gaps drive most detection failures (Picus Blue Report 2025). Push toward internal detection, which cut median dwell to about 9 days (Mandiant M-Trends 2026), and rehearse containment against a minutes-not-hours clock. A red team engagement maps exactly where your gaps are.
How often should we run a red team to benchmark detection?
A single annual test is a snapshot of a moving target, and both attacker tradecraft and your own environment change continuously. A continuous red teaming cadence keeps the benchmark current, and pairing it with retesting validates that a fix actually closed the detection gap rather than just the vulnerability. See our guidance on red team engagement cost for how to budget the cadence.
Related reading
References
Picus Security. The Blue Report 2025. September 2025. https://www.picussecurity.com/blue-report. Breach and attack simulation results from more than 160 million simulations run in the first half of 2025, reporting prevention, logging, and alerting effectiveness against known adversary actions.
Picus Security. The Red Report 2026. February 2026. https://www.picussecurity.com/red-report. Analysis of more than 1.1 million malicious files and 15.5 million adversarial actions from January to December 2025, ranking the most prevalent MITRE ATT&CK techniques.
Mandiant (Google Cloud). M-Trends 2026. March 2026. https://cloud.google.com/blog/topics/threat-intelligence/m-trends-2026. Incident response findings from over 500,000 hours of 2025 investigations, including global median dwell time, detection source, and access handoff speed.
Mandiant (Google Cloud). M-Trends 2025. April 2025. https://cloud.google.com/blog/topics/threat-intelligence/m-trends-2025/. Prior-edition incident response benchmarks used here for year-over-year dwell time and detection source comparisons.
CrowdStrike. 2026 Global Threat Report. February 2026. https://www.crowdstrike.com/en-us/global-threat-report/. Adversary telemetry and intelligence for 2025, including eCrime breakout time and the fastest recorded breakout.
CrowdStrike. 2025 Global Threat Report. 2025. https://www.crowdstrike.com/en-us/blog/crowdstrike-2025-global-threat-report-findings/. Prior-edition breakout-time baseline used for the year-over-year speed comparison.
IBM. Cost of a Data Breach Report 2025. July 2025. https://www.ibm.com/think/x-force/2025-cost-of-a-data-breach-navigating-ai. Survey-based full-lifecycle metrics, including mean time to identify and contain and global average breach cost.
Verizon. 2025 Data Breach Investigations Report. 2025. https://www.verizon.com/business/resources/reports/dbir/. Analysis of a large corpus of confirmed breaches, including ransomware presence and the human element in breaches.
MITRE. ATT&CK Framework. https://attack.mitre.org/. The knowledge base of adversary tactics and techniques referenced throughout the technique-prevalence figures.
Picus Security. Blue Report 2025 launch announcement. September 2025. https://www.picussecurity.com/resource/press-release/picus-launches-blue-report-2025. Primary announcement documenting the 2024 to 2025 baselines for prevention, alerting, and exfiltration defense.
Benchmarks tell you what average looks like. A threat-led red team tells you your number, stage by stage, from the first quiet foothold to the alert that should have fired. Stingrai runs red team and assumed breach engagements that measure detection and response as an adversary would test it, then hands your team a per-stage map of where to close the gap. Explore Stingrai's services or see pricing to scope an engagement.