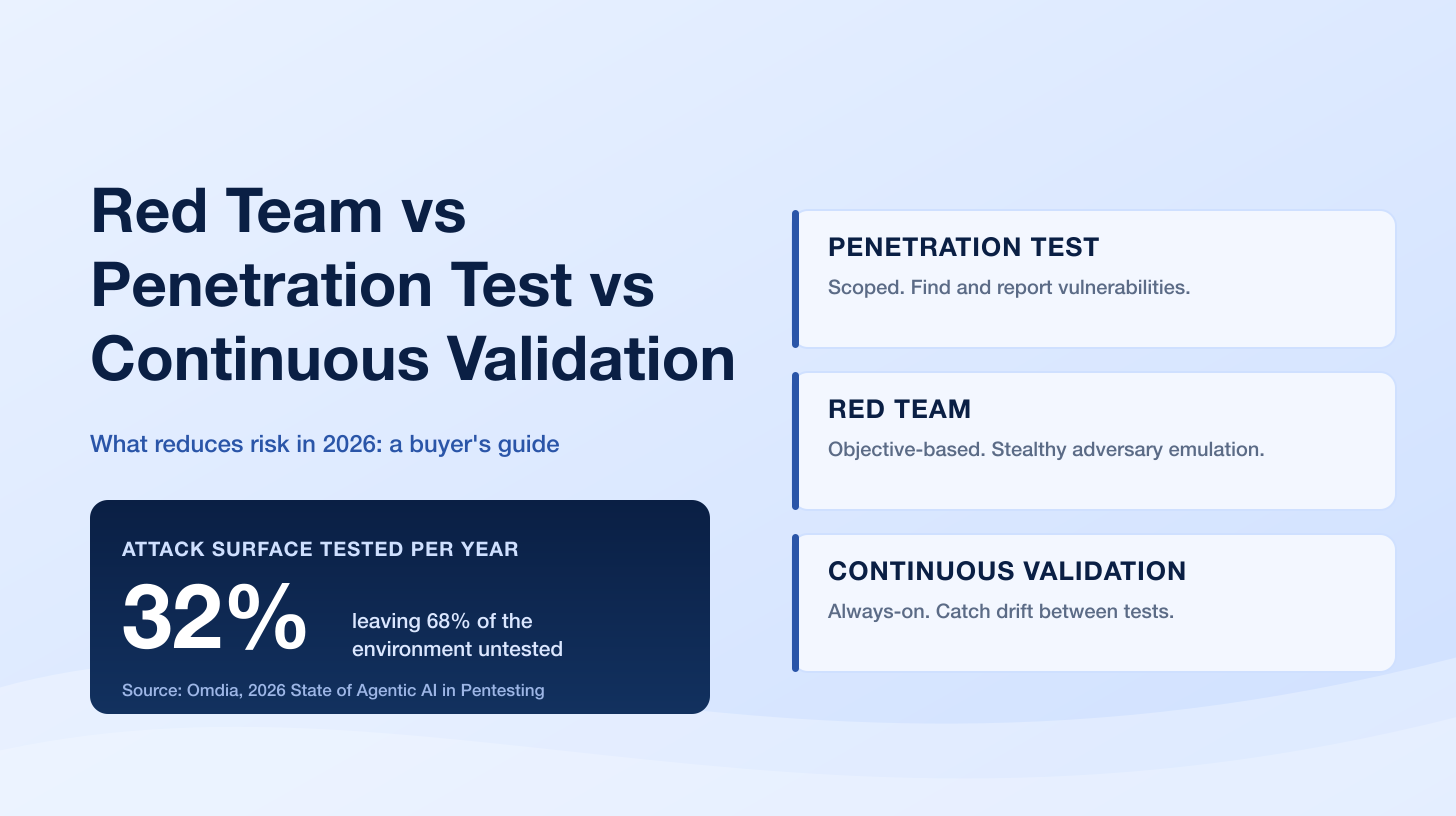
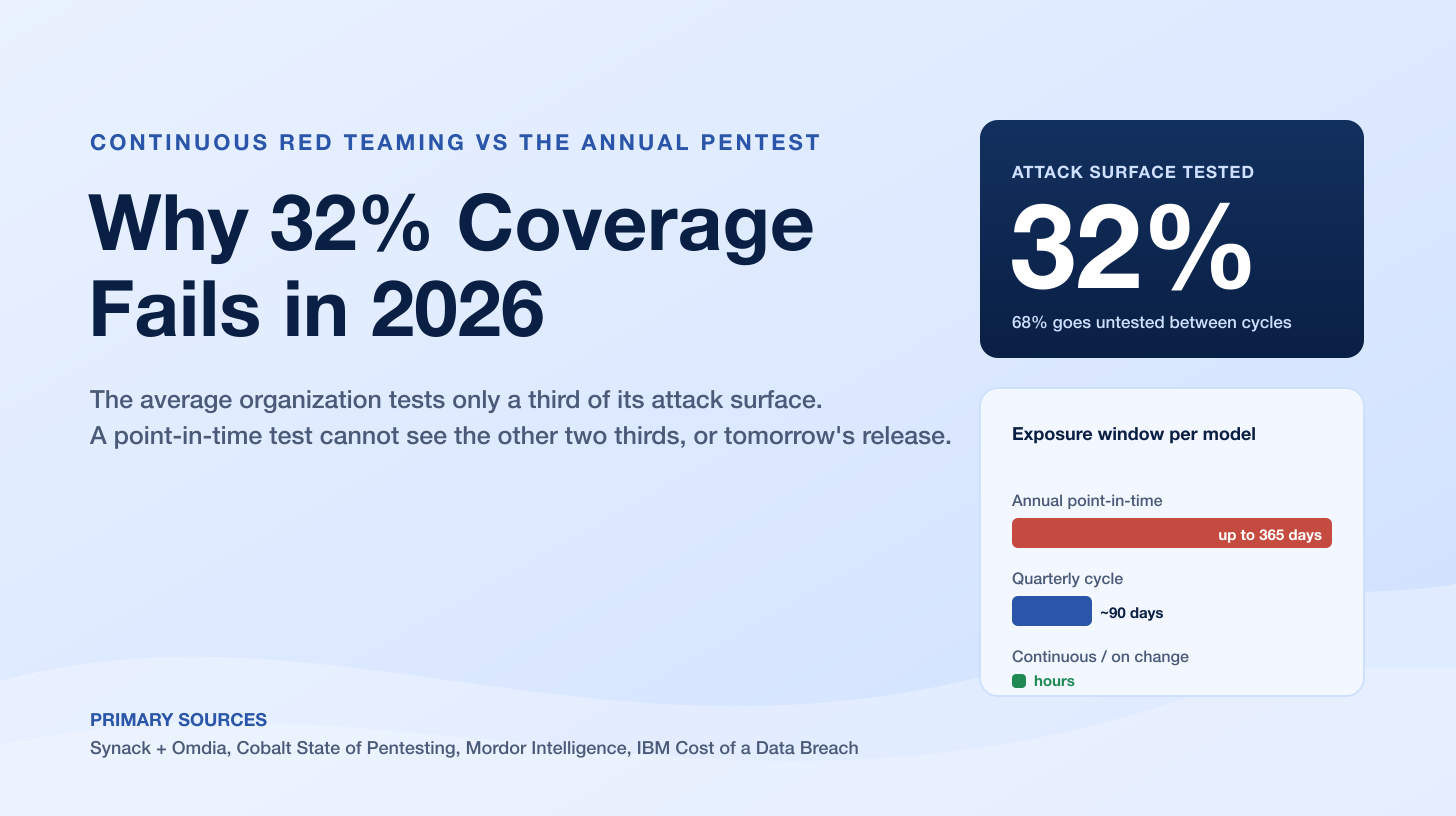
The average organization tests only about 32% of its global attack surface, according to Synack and Omdia's 2026 State of Agentic AI in Pentesting, a study of 200 U.S. security leaders. That leaves roughly 68% of the enterprise environment untested at any given moment. The same research found 95% of organizations rank pentesting a top priority, which is the tell: nearly everyone believes in testing, yet two thirds of what they defend never gets looked at. A once-a-year test cannot close a gap that size, and it was never designed to.
Three forces are driving the move away from the annual point-in-time test in 2026. Release velocity: teams ship code daily, so a January test is stale by February. Adoption: 58% of organizations now use penetration testing as a service (PTaaS), making it the most widely adopted offensive-security model, per Omdia's 2026 offensive-security research of 400 North American professionals. Economics: the penetration testing market is projected to grow from US$2.72B in 2026 to US$5.54B by 2031, a 15.29% CAGR, per Mordor Intelligence. For CISOs, security buyers, and engineering leaders deciding how to spend a limited testing budget, the question is no longer whether to test but how often, and where the annual model quietly fails.
This post is the Stingrai research team's canonical 2026 reference for continuous penetration testing versus the annual point-in-time pentest. It carries 17 primary-sourced statistics drawn from five publishers: Synack and Omdia, Omdia's separate offensive-security study, Cobalt's State of Pentesting Report 2025, Mordor Intelligence, and IBM's Cost of a Data Breach. Lead adoption and coverage data is 2025 and early-2026 telemetry, the freshest available; publishers have not yet released full-year 2026 survey reports as of July 2026. Every stat carries its source, year, and methodology window so any claim can be audited inline.
TL;DR: the numbers that decide the debate
Attack surface tested (2026): only 32% on average, so 68% goes untested (Synack and Omdia, 2026 State of Agentic AI in Pentesting).
PTaaS adoption (2026): 58% now use it, the most widely adopted offensive-security model surveyed (Omdia, 2026).
The drift problem, quantified (2026): 53% of security leaders say traditional, point-in-time offensive security gives a static view that is obsolete by the time the report is delivered (Omdia, 2026).
Time to fix serious findings (2025): a median of 37 days, five times the two-week SLA most teams set (Cobalt State of Pentesting Report 2025).
The confidence gap (2025): 81% of organizations believe their security posture is strong, yet less than half (48%) of vulnerabilities are remediated (Cobalt, 2025).
Serious-vuln closure (2025): only 69% of the highest-risk findings are resolved (Cobalt, 2025).
Pentest market (2026 to 2031): US$2.72B growing to US$5.54B, a 15.29% CAGR (Mordor Intelligence).
Preferred future model (2026): 64% of organizations prefer an agent-led, human-oversight testing model (Synack and Omdia, 2026).
AI product coverage gap (2025): 98% of organizations build generative AI into products, but only 66% run regular security assessments on those AI products (Cobalt, 2025).
Cost of a slow window (2025): the mean time to identify and contain a breach is 241 days; the average global breach costs US$4.44M, and US$10.22M in the United States (IBM Cost of a Data Breach Report 2025).
Key takeaways
The annual pentest fails on coverage before it fails on timing. Even a perfect test only looks at the scope it was given, and the average scope is about a third of the real surface (Synack and Omdia, 2026). The other 68% is not tested badly; it is not tested at all. Fixing the frequency does nothing if the scope stays narrow, which is why continuous testing and broad attack-surface discovery have to travel together.
Drift is the hidden cost, and the market has now named it. More than half of security leaders (53%) say a point-in-time report is obsolete by the time it lands (Omdia, 2026). Between two annual tests, every deploy, dependency bump, and config change adds exposure that no one is checking until the next scheduled engagement.
Confidence is running well ahead of reality. 81% of organizations rate their posture strong, yet fewer than half of found vulnerabilities get fixed and only 69% of the serious ones close (Cobalt, 2025). A once-a-year snapshot flatters that confidence: it produces a clean-looking report on a fixed date and says nothing about the eleven months that follow.
Continuous does not mean human-free. The preferred model is not full automation, it is agent-led testing with human oversight (64%, per Synack and Omdia, 2026), and 94% of leaders say keeping humans in the loop matters (Omdia, 2026). The winning pattern in 2026 is an autonomous agent doing the continuous work and senior testers validating and extending what it finds.
Annual testing is not dead; it is just narrower than it used to be. For a fixed compliance snapshot on a defined scope, a point-in-time test is still the right instrument. The mistake is using that one instrument to answer a question it was never built for: is my whole surface secure today, and tomorrow.
Methodology
This reference draws on five primary publishers, each cited inline where its data appears:
Synack and Omdia, The 2026 State of Agentic AI in Pentesting (commissioned by Synack; released March 19, 2026; survey of 200 U.S. security leaders). Source of the 32% coverage, 68% untested, 95% priority, 87% agentic-AI adoption, and 64% preferred-model figures.
Omdia, Next-generation Offensive Security Strategies Give Defenders the AI Advantage (commissioned research; delivered May 2026; 400 IT and cybersecurity professionals across North America). Source of the 58% PTaaS-adoption, 53% static-view-obsolete, and 94% humans-in-the-loop figures.
Cobalt, State of Pentesting Report 2025 (2025). Source of the 37-day median resolution time, 81% confidence figure, 48% remediation rate, 69% serious-vuln closure, and 98% / 66% AI-product coverage figures.
Mordor Intelligence, Penetration Testing Market Size, Share, Trends and Industry Report, 2031 (published March 6, 2026). Source of the US$2.72B (2026) to US$5.54B (2031) market projection at a 15.29% CAGR.
IBM, Cost of a Data Breach Report 2025 (2025; produced with the Ponemon Institute). Source of the US$4.44M global and US$10.22M U.S. average breach cost and the 241-day mean time to identify and contain.
The research pass closed on July 1, 2026. Every figure was retrieved from its named primary publisher and matched to the exact reported number. Statistics that could not be reached on at least one verification pass against a named primary source were dropped rather than estimated or hedged. Where two publishers size the same market differently, this post uses a single source (Mordor Intelligence) rather than blending methodologies.
Why the annual point-in-time pentest leaves gaps
The annual pentest is a snapshot. It answers one question well: on this date, against this defined scope, what could a skilled tester exploit? That answer is genuinely useful, and for years it was enough, because the thing being tested did not change much between engagements. In 2026 that assumption no longer holds.
Gap 1: coverage, not just cadence
The most damaging limitation of the annual model is not how rarely it runs, it is how little it sees each time. Organizations test about 32% of their attack surface on average, leaving 68% unexamined (Synack and Omdia, 2026). Scope is usually set by budget and time, so the annual engagement covers the applications and networks someone remembered to list, not the full inventory of internet-facing assets, shadow APIs, forgotten subdomains, and newly spun-up cloud services. A perfectly executed test of the wrong third of your surface is still a failing grade on coverage.
Gap 2: drift between tests
Between two annual engagements, the target keeps moving. Teams ship features, patch dependencies, change IAM policies, and stand up new infrastructure. Each change can introduce a vulnerability that the last test could not have seen and the next one will not see for months. This is drift, and the market has now put a number on how much it bothers practitioners: 53% of security leaders say a traditional, point-in-time offensive-security view is obsolete by the time the report is delivered (Omdia, 2026).
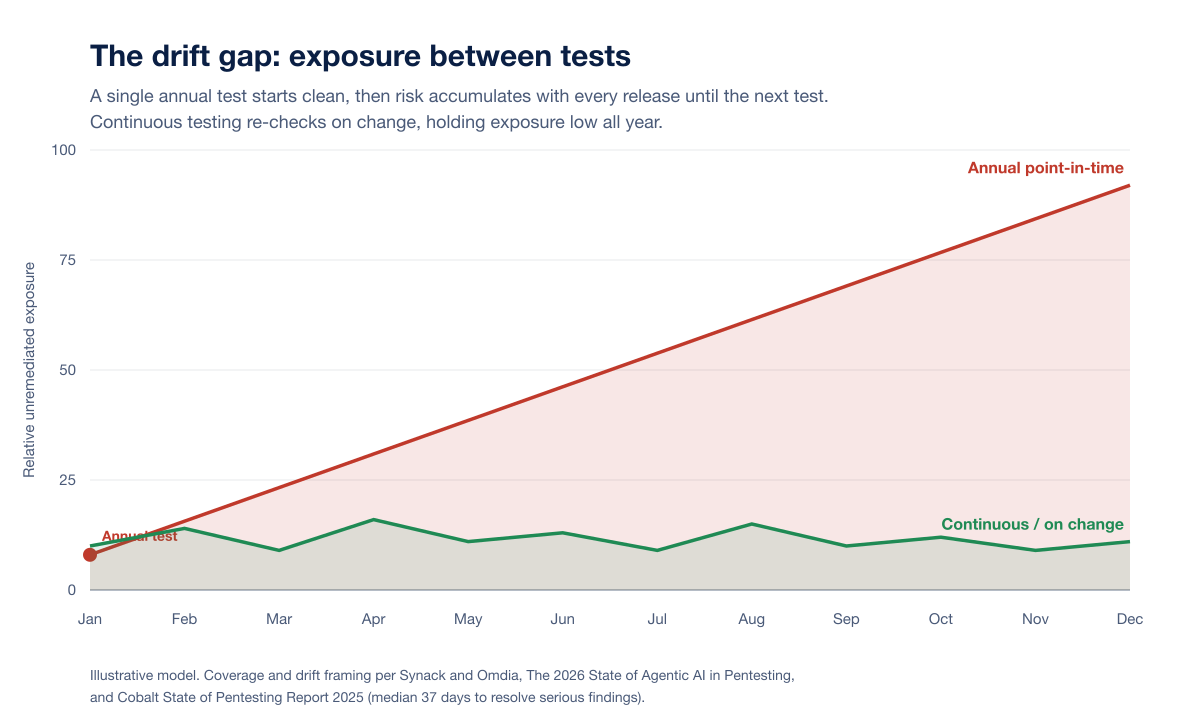
The shape of the problem is simple. Right after an annual test, exposure is low because findings were just fixed. Then it climbs with every release until the next test resets it. Continuous testing keeps re-checking on change, so exposure never gets the chance to accumulate. That is the drift gap, and it is invisible on any single point-in-time report because the report only shows the one clean day it was run.
Gap 3: the time-to-fix window
Even when a test finds something, closing it takes time. The median time to resolve a serious pentest finding is 37 days, roughly five times longer than the two-week SLA most teams set for themselves (Cobalt, 2025). Stack that on an annual cadence and the math gets uncomfortable: a serious flaw introduced a week after the test can live for nearly a full year before the next engagement finds it, plus another month to fix. Meanwhile, the mean time to identify and contain an actual breach is 241 days (IBM, 2025). The window a point-in-time model leaves open is wide enough to drive an incident through.
Gap 4: false confidence
Annual reports create a comfortable illusion. 81% of organizations believe their security posture is strong, yet fewer than half (48%) of discovered vulnerabilities are actually remediated, and only 69% of the highest-risk findings get resolved (Cobalt, 2025). A single annual snapshot reinforces that confidence because it hands over a clean-looking artifact on a fixed date. It says nothing about whether the fixes stuck, whether new code reopened old holes, or whether the untested 68% ever got attention.
What continuous penetration testing and PTaaS actually deliver
Continuous penetration testing, usually delivered as penetration testing as a service (PTaaS), replaces the one-day snapshot with an always-on program. The surface is discovered and re-tested on change, findings flow into the tools engineers already use, and retesting confirms fixes without waiting for next year. (For a deeper primer on the delivery model itself, see our guide to continuous PTaaS explained.) It is now the most widely adopted offensive-security model, with 58% of organizations using PTaaS (Omdia, 2026), and the broader penetration testing market is on track to nearly double from US$2.72B in 2026 to US$5.54B by 2031 (Mordor Intelligence).
Testing on change, not on the calendar
The defining feature of continuous testing is that a code change, not a date on a contract, triggers the next test. When a pull request touches an authorization check, that PR gets tested before it ships, not eleven months later. This is where drift gets shut down: exposure never accumulates because the surface is re-examined every time it moves.
Broader, discovered coverage
Continuous programs pair testing with attack-surface discovery, so the scope tracks the real inventory instead of a stale list. That is the direct answer to the 32% problem. You cannot test what you have not found, and an annual engagement rarely has the time to find everything first. A continuous model keeps the map current.
Faster feedback into engineering
PTaaS routes findings into ticketing and chat systems and supports retesting on demand, which attacks the 37-day resolution median from both ends: engineers see issues sooner and can get a fix verified without scheduling a new engagement. The point is not just to find faster but to close faster.
Human-led, not human-free
Continuous does not mean handing everything to a scanner. The preferred model is agent-led with human oversight (64%) (Synack and Omdia, 2026), and 94% of leaders say humans-in-the-loop matters (Omdia, 2026). Automated tools are excellent at running constantly and catching known-class issues at scale. Senior humans are still essential for chaining findings, judging business impact, and probing the complex authorization and business-logic flaws that decide real breaches. The strongest programs use both: an autonomous agent for continuous breadth and experienced testers for depth and validation.
When each model fits: a buyer decision framework
The honest answer is that both models have a place, and the mistake is using one where the other belongs. Annual point-in-time testing still fits a fixed compliance snapshot on a defined scope. Continuous testing fits everything that changes between those snapshots.
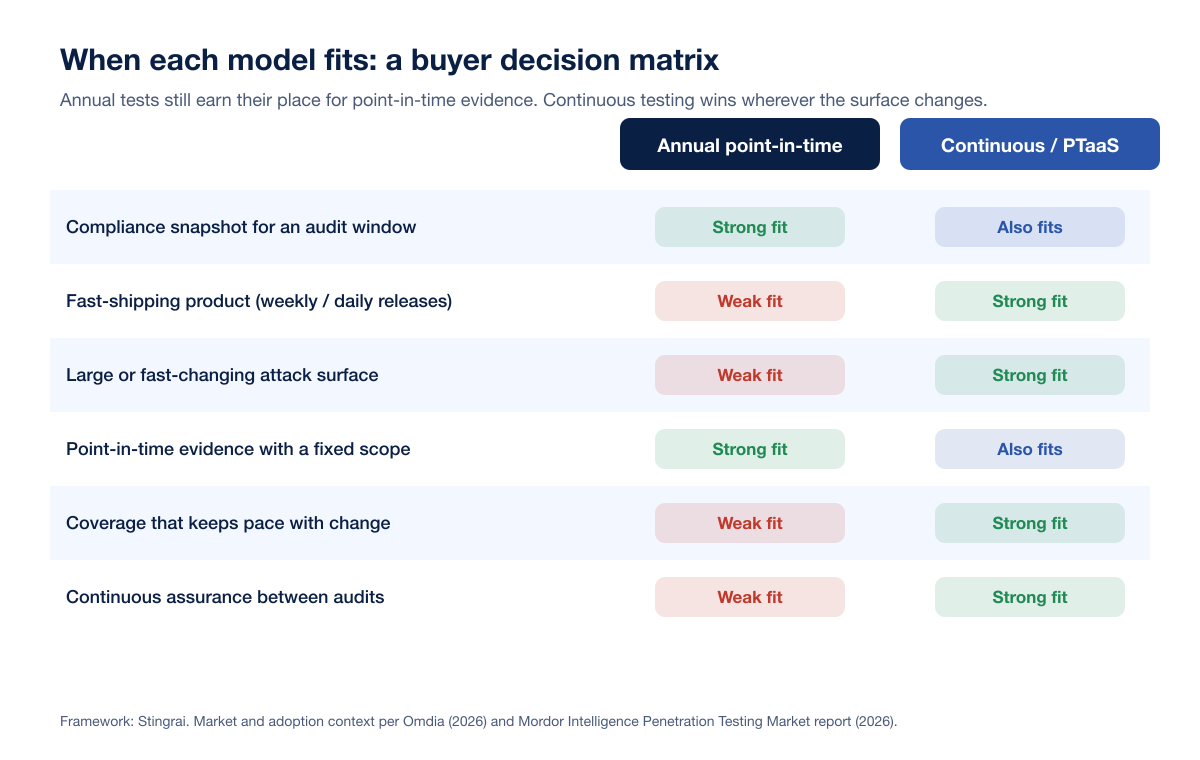
Use this framework to decide:
Do you ship often? If you release weekly or daily, an annual test is stale almost immediately. Continuous testing keeps pace; a point-in-time test cannot.
Is your surface large or fast-changing? If cloud, APIs, and new services appear faster than a scoping call can track them, you need discovery plus continuous coverage, not a fixed annual scope.
What is the deliverable you actually need? If it is point-in-time evidence for a specific audit window with a fixed scope, an annual test is a clean fit. If it is ongoing assurance that today's build is secure, continuous testing is the only model that answers the question.
What is your risk tolerance for the gap? If you can accept up to a year of unverified drift, annual may be defensible. If you cannot, the drift window is the deciding factor.
For most modern software organizations the answer is a blend: continuous testing as the backbone, with a deeper periodic engagement or red-team exercise layered on top for adversary-emulation depth and, where required, a formal point-in-time report. The two are complements, not competitors. The failure mode is buying only the annual test and assuming it covers a surface that changes every day. If you are weighing the two delivery models specifically, our continuous pentesting versus PTaaS breakdown goes deeper on how the terms differ in practice.
What this means for defenders
The data points to a small set of concrete moves for security and engineering leaders in 2026:
Measure your real coverage first. If you do not know what fraction of your surface is tested, assume it is near the 32% average and start with attack-surface discovery. You cannot close a gap you have not measured.
Move testing left and make it continuous. Trigger tests on change so the drift window never opens. Gate risky pull requests, especially those touching authentication, authorization, and access control, before they merge.
Shorten the fix loop, not just the find loop. Route findings into engineering tools and retest on demand so serious issues close well inside the 37-day median rather than lingering to the next annual cycle.
Keep senior humans on the complex classes. Automate the constant, high-volume checks; reserve experienced testers for chaining, business logic, and authorization flaws that automation alone misses.
Keep the annual test for what it is good at. Use point-in-time engagements for fixed-scope compliance evidence and deeper red-team exercises, not as a stand-in for continuous coverage.
This is exactly the model Stingrai PTaaS is built to deliver. Snipe, Stingrai's autonomous web-application testing agent, runs continuously and on change: it performs black-box dynamic testing and white-box source-code review, hunts complex, high-impact classes like IDOR, business-logic, and broken-authorization flaws that generic scanners miss, opens AutoFix pull requests for what it finds, and can run as a PR-gating check that blocks vulnerable code from merging. Snipe is custom-trained on more than 6,000 HackerOne Hacktivity disclosure reports and on skills distilled from years of Stingrai's human pentesters' methodology, so it encodes how senior testers actually find these bugs. Senior Stingrai testers then validate and extend those findings, so coverage is continuous and validated rather than continuous and shallow. That combination directly supports your SOC 2, ISO 27001, and PCI DSS compliance program with pentest evidence, while covering the drift a once-a-year test never sees. You can compare the continuous and periodic options on the Stingrai pricing page.
Frequently asked questions
What percentage of the attack surface do organizations actually test in 2026?
Organizations test only about 32% of their global attack surface on average, according to Synack and Omdia's 2026 State of Agentic AI in Pentesting, a survey of 200 U.S. security leaders. That leaves roughly 68% of the enterprise environment untested at any given moment, which is the core coverage gap that annual point-in-time testing cannot close on its own.
What is the difference between continuous penetration testing and a traditional annual pentest?
A traditional pentest is a point-in-time snapshot: it tests a fixed scope on a fixed date and produces a report that starts aging immediately. Continuous penetration testing, usually delivered as PTaaS, tests the surface on change and re-checks it throughout the year, so exposure does not accumulate between engagements. The practical difference is drift: 53% of security leaders say a point-in-time view is obsolete by the time the report is delivered (Omdia, 2026).
Is PTaaS replacing traditional penetration testing?
PTaaS is now the most widely adopted offensive-security model, with 58% of organizations using it (Omdia, 2026), and the penetration testing market is projected to grow from US$2.72B in 2026 to US$5.54B by 2031 (Mordor Intelligence). It is not fully replacing point-in-time testing, though. Annual engagements still fit fixed-scope compliance snapshots and deeper red-team exercises. The trend is toward continuous testing as the backbone, with periodic deep engagements layered on top.
When does an annual point-in-time pentest still make sense?
An annual test is the right instrument when you need point-in-time evidence for a defined scope, such as a compliance audit that requires a report as of a specific date, or a deep red-team exercise that emulates a determined adversary against a bounded target. It stops making sense as your only control when your surface changes frequently, because it leaves a drift window of up to a year during which new code goes unchecked.
Does continuous testing remove the need for human pentesters?
No. The preferred model is agent-led with human oversight, chosen by 64% of organizations (Synack and Omdia, 2026), and 94% of leaders say keeping humans in the loop matters (Omdia, 2026). Autonomous agents run continuously and catch a large share of issues at scale, but senior testers are still needed to chain findings, judge business impact, and probe complex authorization and business-logic flaws. Stingrai PTaaS combines both: the Snipe agent for continuous coverage and senior testers for validation and depth.
How much does the annual-only model cost when a gap is missed?
The average global data breach cost US$4.44M in 2025, and US$10.22M in the United States, with a mean time to identify and contain of 241 days (IBM Cost of a Data Breach Report 2025). Against a 241-day detection window and a 37-day median fix time for serious findings (Cobalt, 2025), a testing gap of up to a year is expensive risk. Continuous testing narrows that window by finding and verifying fixes as changes ship rather than once a year.
References
Synack and Omdia. The 2026 State of Agentic AI in Pentesting. March 19, 2026. https://www.prnewswire.com/news-releases/95-of-enterprises-prioritize-pentesting-yet-only-32-of-attack-surfaces-are-tested-new-synack-and-omdia-research-finds-302718985.html. Commissioned survey of 200 U.S. security leaders on attack-surface coverage, pentest priorities, and agentic-AI adoption. Source of the 32% coverage, 68% untested, 95% priority, 87% adoption, and 64% preferred-model figures.
Omdia. Next-generation Offensive Security Strategies Give Defenders the AI Advantage. May 2026. https://www.businesswire.com/news/home/20260610819228/en/Majority-of-Security-Leaders-Say-Traditional-Pentesting-Cant-Keep-Pace-with-Modern-Threats-Omdia-Research-Finds. Survey of 400 IT and cybersecurity professionals across North America. Source of the 58% PTaaS-adoption, 53% static-view-obsolete, and 94% humans-in-the-loop figures.
Cobalt. State of Pentesting Report 2025. 2025. https://www.cobalt.io/blog/key-takeaways-state-of-pentesting-report-2025. Aggregated pentest program data. Source of the 37-day median time to resolve serious findings, 81% security-confidence figure, 48% remediation rate, 69% serious-vuln closure, and 98% / 66% AI-product coverage figures.
Mordor Intelligence. Penetration Testing Market Size, Share, Trends and Industry Report, 2031. March 6, 2026. https://www.mordorintelligence.com/industry-reports/penetration-testing-market. Market sizing and forecast. Source of the US$2.72B (2026) to US$5.54B (2031) projection at a 15.29% CAGR.
IBM. Cost of a Data Breach Report 2025. 2025 (produced with the Ponemon Institute). https://www.ibm.com/reports/data-breach. Global breach-cost benchmarking. Source of the US$4.44M global and US$10.22M U.S. average breach cost and the 241-day mean time to identify and contain.