




In IBM X-Force's 2025 incident data, exploiting public-facing applications became the most common way into organizations. Its 2026 Threat Intelligence Index, published on 25 February 2026, counted it in 40% of incidents, after a 44% rise, ahead of valid credentials at 32%. The Verizon 2026 Data Breach Investigations Report, published in May 2026 with more than 22,000 confirmed breaches, shows the same shift: exploitation of vulnerabilities rose to 31% of known initial access vectors, up from 20%, and overtook credential abuse.
Inside the application, close to half the problems are about identity. In Stingrai's own data, 768 verified findings from 40 web application penetration tests between October 2024 and August 2026, authentication and session flaws were the largest class at 28.1%, and 70% of the tests surfaced at least one High or Critical authentication or authorization finding (State of Penetration Testing 2026). The OWASP Top 10:2025 keeps broken access control first. Fixing lags finding: Edgescan measured 54.8 days on average to remediate high and critical application and API vulnerabilities in 2025.
This post is the Stingrai research team's 2026 reference for web application security statistics. It brings together more than 90 figures from 15 primary publishers, including Verizon, IBM, Google Mandiant, CISA, NIST, MITRE and OWASP, plus Stingrai's penetration testing data and two counts computed for this page from the NIST National Vulnerability Database (NVD) and the CISA Known Exploited Vulnerabilities (KEV) catalog. Lead data is full-year 2025 telemetry from 2026 editions, the freshest available; no publisher has released full-year 2026 figures as of 13 October 2026. Every figure carries its source and edition, plus its data window where the publisher gives one, so any claim can be audited inline.
Quick answer. Exploits are the most common way in: exploitation of public-facing applications led IBM X-Force's 2025 incident data at 40% of cases, and the Verizon 2026 DBIR counted 2,281 confirmed breaches in its Basic Web Application Attacks pattern, where stolen credentials were used in 56% and exploited vulnerabilities in 53%. Broken access control tops the OWASP Top 10:2025, and in Stingrai's 40 web application penetration tests 54% of findings were High or Critical, with authentication and session flaws the largest class (28.1%). Fixes take time: Edgescan measured 54.8 days on average for high and critical application flaws in 2025. Stingrai's web application penetration testing tests these classes signed in as every user role.
TL;DR: key web application security statistics
Exploitation of public-facing applications (IBM X-Force, 2025 incidents): 40% of cases, the most common initial access vector, after a 44% increase (IBM X-Force 2026).
Vulnerability exploitation as an initial access vector (Verizon 2026 DBIR): 31% of known initial access vectors in non-Error, non-Misuse breaches, up from 20% (Verizon 2026 DBIR, p. 15).
Basic Web Application Attacks (Verizon 2026 DBIR): 2,281 confirmed breaches; stolen credentials used in 56% and exploited vulnerabilities in 53% of the 2,193 analyzed (Verizon, p. 54).
Web application tests with a High or Critical authentication or authorization finding (Stingrai, October 2024 to August 2026): 70% of 40 tests (Stingrai, State of Penetration Testing 2026).
Web application test findings (Stingrai, 40 tests): 768 verified findings, a median of 8 per test, 54% High or Critical; authentication and session the largest class at 28.1% (Stingrai report).
OWASP Top 10:2025, first place: broken access control, with 1,839,701 occurrences in OWASP's data, the most of any category (OWASP).
CVE records with authorization weaknesses versus XSS (NVD, 2026 to 13 October): 8,171 versus 7,049, the first year since 2021 in this count that authorization leads, much of it from two CNAs (Stingrai analysis of the NIST NVD API).
KEV additions in web weakness classes (CISA catalog, 2026 to 8 October): 123 of the 246 entries with a CWE, 50.0% (Stingrai analysis of the CISA KEV catalog).
Global traffic mitigated by Cloudflare (2025): 6.2% for any reason, including customer rules; 3.3% as DDoS attacks or by managed rules (Cloudflare Radar 2025 Year in Review).
Malicious requests blocked across 1,400+ applications (Indusface, 2025 data): 10.54 billion; attacks per website up 27% (Indusface 2026).
Average time to remediate high or critical application and API vulnerabilities (Edgescan, 2025 data): 54.8 days (Edgescan, p. 20).
Median days to resolve Critical versus High findings, where resolution was tracked (Stingrai, all test types): 10.5 versus 38 (Stingrai remediation data, CC BY 4.0).
Key takeaways
The application is now the front door, not the password. X-Force's 40% and the DBIR's 31% both show exploits overtaking stolen credentials as the leading way in.
Inside the app, identity and authorization lead what testers find. Authentication and session flaws were 28.1% of Stingrai's web application findings, and Edgescan's most common critical findings that automation rarely catches are APIs reachable without authentication or with weak authentication (16%) and access restriction bypass (14%).
Authorization is overtaking cross-site scripting in the CVE record. Cross-site scripting is first in the 2025 CWE Top 25 and appeared on 8,295 NVD records in 2025, but in 2026 to 13 October authorization weaknesses appear on more records (8,171 against 7,049), and missing authorization rose to fourth in the CWE Top 25.
Remediation, not discovery, is the bottleneck. Edgescan's 54.8-day average, Veracode's 82% of organizations carrying security debt and the DBIR's 26% full-remediation rate for KEV vulnerabilities agree, and Stingrai's tracked High findings, across all test types, took a median 38 days against 10.5 for Critical.
Methodology
Sources. Incident reports, edge telemetry, application testing datasets, standards, public vulnerability records and Stingrai's State of Penetration Testing 2026, each listed with its date in the References. Sources were read and counts were run on 13 October 2026.
Rules applied. Each figure is reported as its publisher states it and compared only within its own source. Vendor telemetry describes that vendor's customers. Figures a source contradicts were dropped: Indusface's report swaps the labels on its website and API exploit growth figures (56% and 181%) between two pages, so neither is used. Figures that could not be confirmed against a primary source were dropped rather than estimated. The Veracode and Cobalt full reports sit behind registration forms, so their figures come from the publishers' and Cyentia Institute's summary pages.
Counts computed for this page. The NVD count covers all 239,892 CVE records published from 1 January 2021 to 13 October 2026 (rejected records excluded), retrieved through the NVD CVE API 2.0 on 13 October 2026; a record counts in a class if any CWE on it, from NVD or from the CVE Numbering Authority (CNA), matches. The API's cweId filter matches only the CWE that NVD lists as primary: it returned 875 records for CWE-79 published in 2025, against 8,295 that carry CWE-79 from any source; 88.7% carry it only from the CNA. The KEV count uses catalog version 2026.10.08 (1,739 entries) and 13 classes that web application testing covers: CWE-22, 77, 78, 79, 89, 94, 352, 434, 502, 611 and 918, plus authentication (CWE-287, 288, 306) and authorization (CWE-285, 639, 862, 863). A CWE match is a class match, not proof that the flaw sits in a web application: some entries are appliance consoles and a few are desktop products.
Stingrai data. 55 penetration tests and 1,206 verified findings from October 2024 to August 2026, each reproduced by a penetration tester and entered into a two-stage review: one firm's book of work, not an industry rate. Remediation times cover only the 163 findings where resolution was tracked.
How attackers get into web applications
Three incident datasets published in 2026 put exploitation at the top of the initial access list:
IBM X-Force (2025 incident response data). Exploitation of public-facing applications rose 44% and accounted for 40% of cases; valid credentials accounted for 32%.
Verizon 2026 DBIR (incidents from 1 November 2024 to 31 October 2025). Exploitation of vulnerabilities reached 31% of known initial access vectors, up from 20%. Credential abuse fell from 22% to 13%, partly because Verizon now counts pretexting separately (16% on the old basis), and still appears somewhere in 39% of breaches.
Google Mandiant M-Trends 2026 (2025 investigations). Exploits were the most common initial infection vector for the sixth year running, at 32% of intrusions.
These counts cover any internet-facing software, including VPN and firewall appliances, not only web applications. The DBIR's Basic Web Application Attacks pattern isolates the web part: 3,217 incidents and 2,281 confirmed breaches in the 2026 edition, about 10% of all breaches. External actors were behind all of them and financial motives drove 74% (espionage 23%). Credentials were compromised in 52% of these breaches, internal data in 48% and secrets in 15%. Verizon says better partner visibility may explain part of the pattern's growth.
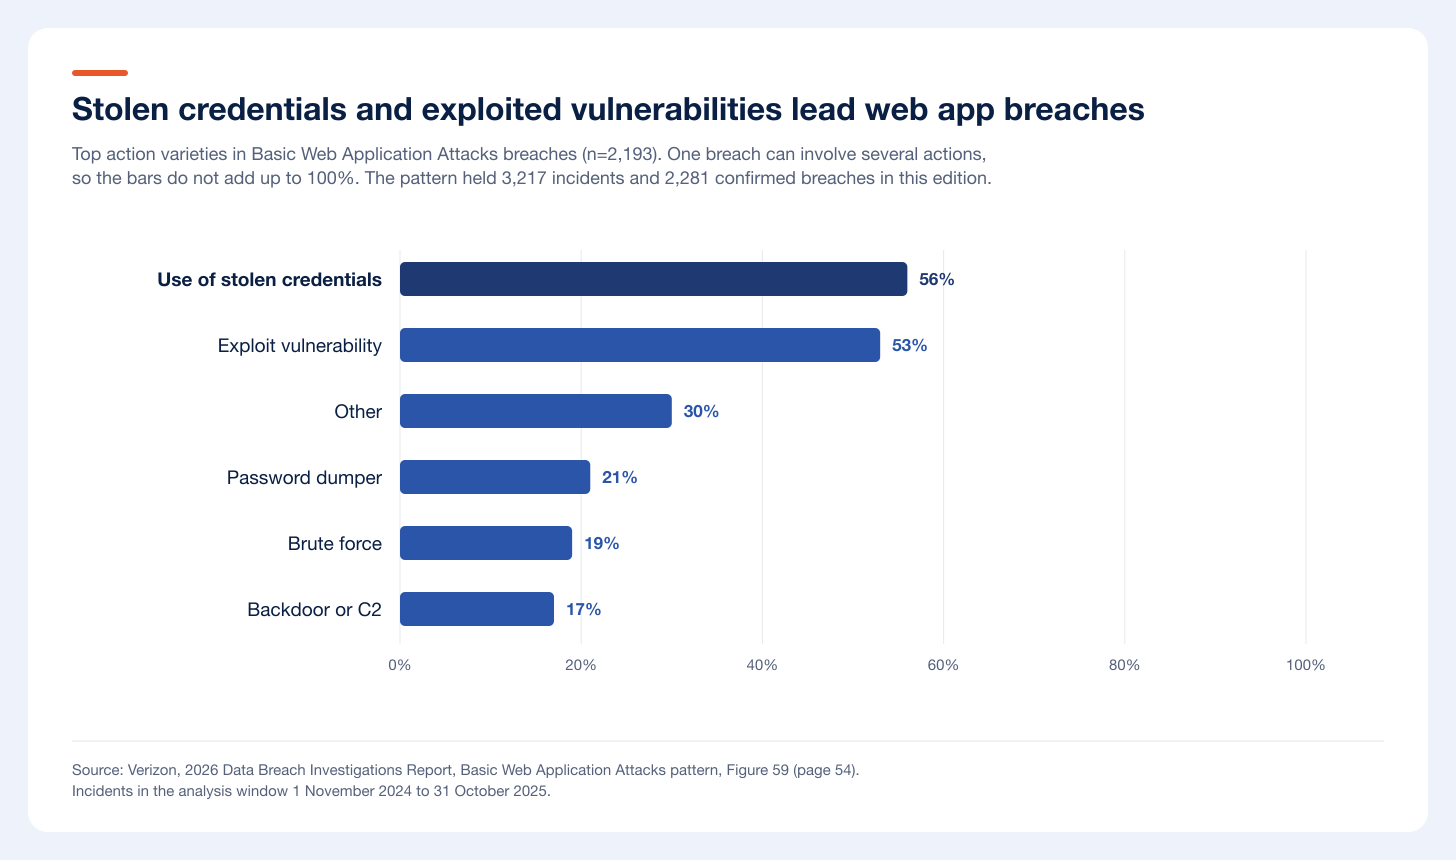
Figure 1: Top action varieties in Basic Web Application Attacks breaches (n=2,193); a breach can involve several actions. Source: Verizon 2026 Data Breach Investigations Report, Figure 59, p. 54.
Stolen credentials remain the top action at 56%, with exploited vulnerabilities close behind at 53%; Verizon attributes the rise in exploits to "several large cases involving software vulnerabilities that were left unpatched and later exploited".
What it costs. In IBM's Cost of a Data Breach Report 2026 (602 organizations breached between March 2025 and February 2026), breaches that began by exploiting a public-facing application cost USD 4.68 million on average, the lowest of the eight initial attack vectors IBM charts and below the USD 4.99 million global average. IBM's sample is non-statistical and its costs are interview-based estimates, so treat the figure as an indicator.
Attack traffic at the edge
Cloudflare's Radar 2025 Year in Review (1 January to 2 December 2025) reports that 6.2% of global traffic on its network was mitigated, as potentially malicious or for customer-defined reasons, and 3.3% as a DDoS attack or by managed rules. Indusface's State of Application Security 2026, covering more than 1,400 applications on its platform in 2025, counted 10.54 billion blocked malicious requests and a 27% rise in attacks per website; 90% of websites saw at least one bot attack and 70% at least one DDoS attack. Both describe each vendor's own customer traffic.
The weaknesses web applications ship with
The OWASP Top 10:2025 was published as a release candidate in November 2025 and finalized in December 2025. It draws on 2021 to 2024 data for more than 2.8 million applications: eight categories come from the data and two from a community survey.
Rank | Category | Change from 2021 | Data point |
|---|---|---|---|
A01 | Broken Access Control | Stays 1st; SSRF folded in | Avg incidence 3.73%, 40 CWEs |
A02 | Security Misconfiguration | Up from 5th | Avg incidence 3.00%, 16 CWEs |
A03 | Software Supply Chain Failures | New, widens Vulnerable and Outdated Components | Fewest occurrences, highest exploit and impact scores |
A04 | Cryptographic Failures | Down from 2nd | Avg incidence 3.80%, 32 CWEs |
A05 | Injection | Down from 3rd | Most CVEs of any category, 37 CWEs |
A06 | Insecure Design | Down from 4th | Introduced in 2021 |
A07 | Authentication Failures | Stays 7th, renamed | 36 CWEs |
A08 | Software or Data Integrity Failures | Stays 8th | Trust boundaries and integrity |
A09 | Security Logging and Alerting Failures | Stays 9th, renamed | Voted in by the survey |
A10 | Mishandling of Exceptional Conditions | New | 24 CWEs |
Source: OWASP Top 10:2025 introduction and category pages. Rankings combine maximum incidence rate, coverage, exploit and impact scores and total occurrences, so A04's higher average incidence does not lift its rank.
The 2025 CWE Top 25, released by MITRE and CISA on 11 December 2025 from 39,080 CVE records published between 1 June 2024 and 1 June 2025, is led by web weaknesses: cross-site scripting (CWE-79) first, SQL injection (CWE-89) second, cross-site request forgery (CWE-352) third and missing authorization (CWE-862) fourth, up five places. Authorization bypass through a user-controlled key (CWE-639, the IDOR weakness) is 24th, up six. CISA's Vulnerability Review (August 2026) adds that cross-site scripting again dominated the most common CWEs in fiscal year 2025, and that seven of the top 10 CWEs in that year's KEV data were injection, input validation or file-handling weaknesses.
Edgescan's 2026 Vulnerability Statistics Report, built on assessments and penetration tests run on its platform in 2025, rated 31.9% of web application and API vulnerabilities critical (21.2%) or high (10.7%), against 20% across all internet-facing assets. SQL injection was 37.18% of critical and high findings on public-facing web applications and APIs, followed by sensitive file disclosure (17.80%), path traversal (10.26%) and IDOR (5.37%). Third-party code adds to the load: Datadog's State of DevSecOps 2026 found that 87% of organizations run at least one service with a known exploitable vulnerability, affecting 40% of services.
CVE and KEV counts for web weakness classes
Stingrai counted all 239,892 CVE records the NVD published from 1 January 2021 to 13 October 2026 by weakness class. Cross-site scripting appeared on 8,295 records published in 2025, three times the 2,683 of 2021 and 17.2% of the year's 48,152 records. Authorization weaknesses grew faster: records with missing authorization (CWE-862) or IDOR (CWE-639) rose from 332 in 2021 to 2,766 in 2025 and 5,905 in 2026 to 13 October. Counting all four authorization CWEs, 2026 is the first year in this count in which authorization (8,171 records) outnumbers cross-site scripting (7,049). Part of that is volume, since the NVD has already published 77,749 records in 2026, but authorization's share also rose, from 7.3% to 10.5% of all records. Two CNAs drove much of the jump: GitHub (1,725 authorization records, up from 194) and VulnCheck (1,247, up from 29). Plugin ecosystems drive much of the web count: two CNAs, Wordfence (scope: WordPress plugins, themes and core) and Patchstack (third-party PHP and JavaScript software), published 49% of 2025's XSS records and 78% of its missing authorization records.
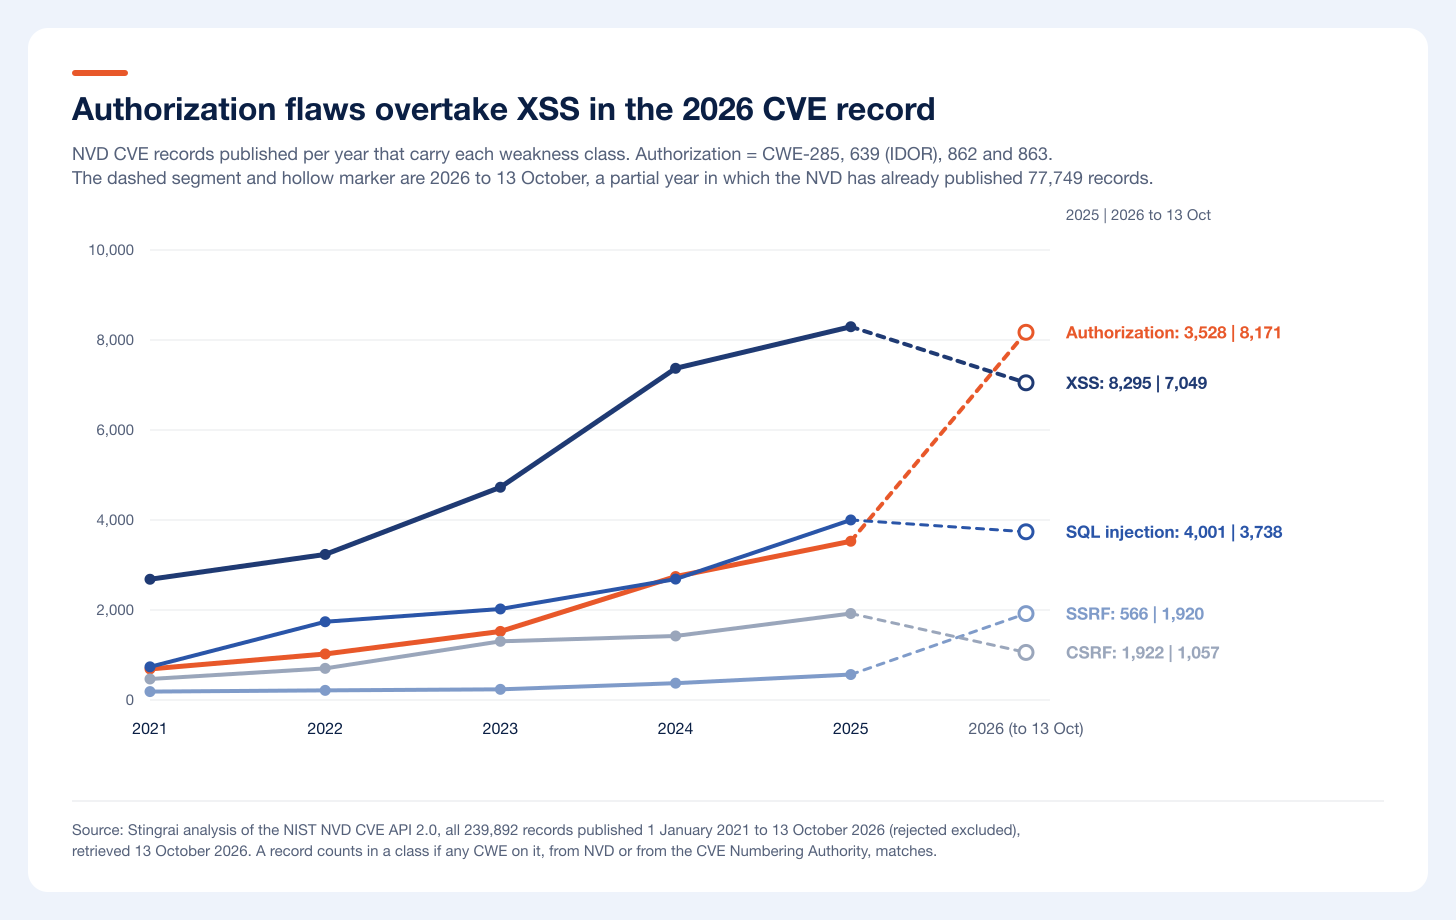
Figure 2: NVD CVE records published per year by web weakness class, 2021 to 2026, with 2026 to 13 October dashed. Authorization covers CWE-285, 639, 862 and 863. Source: Stingrai analysis of the NIST NVD CVE API 2.0, retrieved 13 October 2026.
Patchstack's State of WordPress Security in 2026 counted 11,334 new vulnerabilities in the WordPress ecosystem in 2025, 42% more than in 2024; 91% were in plugins, 46% had no developer fix by public disclosure, and the weighted median time to first exploitation of heavily targeted flaws was 5 hours.
In the KEV catalog (version 2026.10.08), 614 of 1,739 entries carry at least one of the 13 web weakness classes, 39.3% of the entries that list a CWE. The share of each year's additions has risen every year since 2022, from 27.6% to 46.1% in 2024, 47.3% in 2025 and 50.0% in 2026 to 8 October.
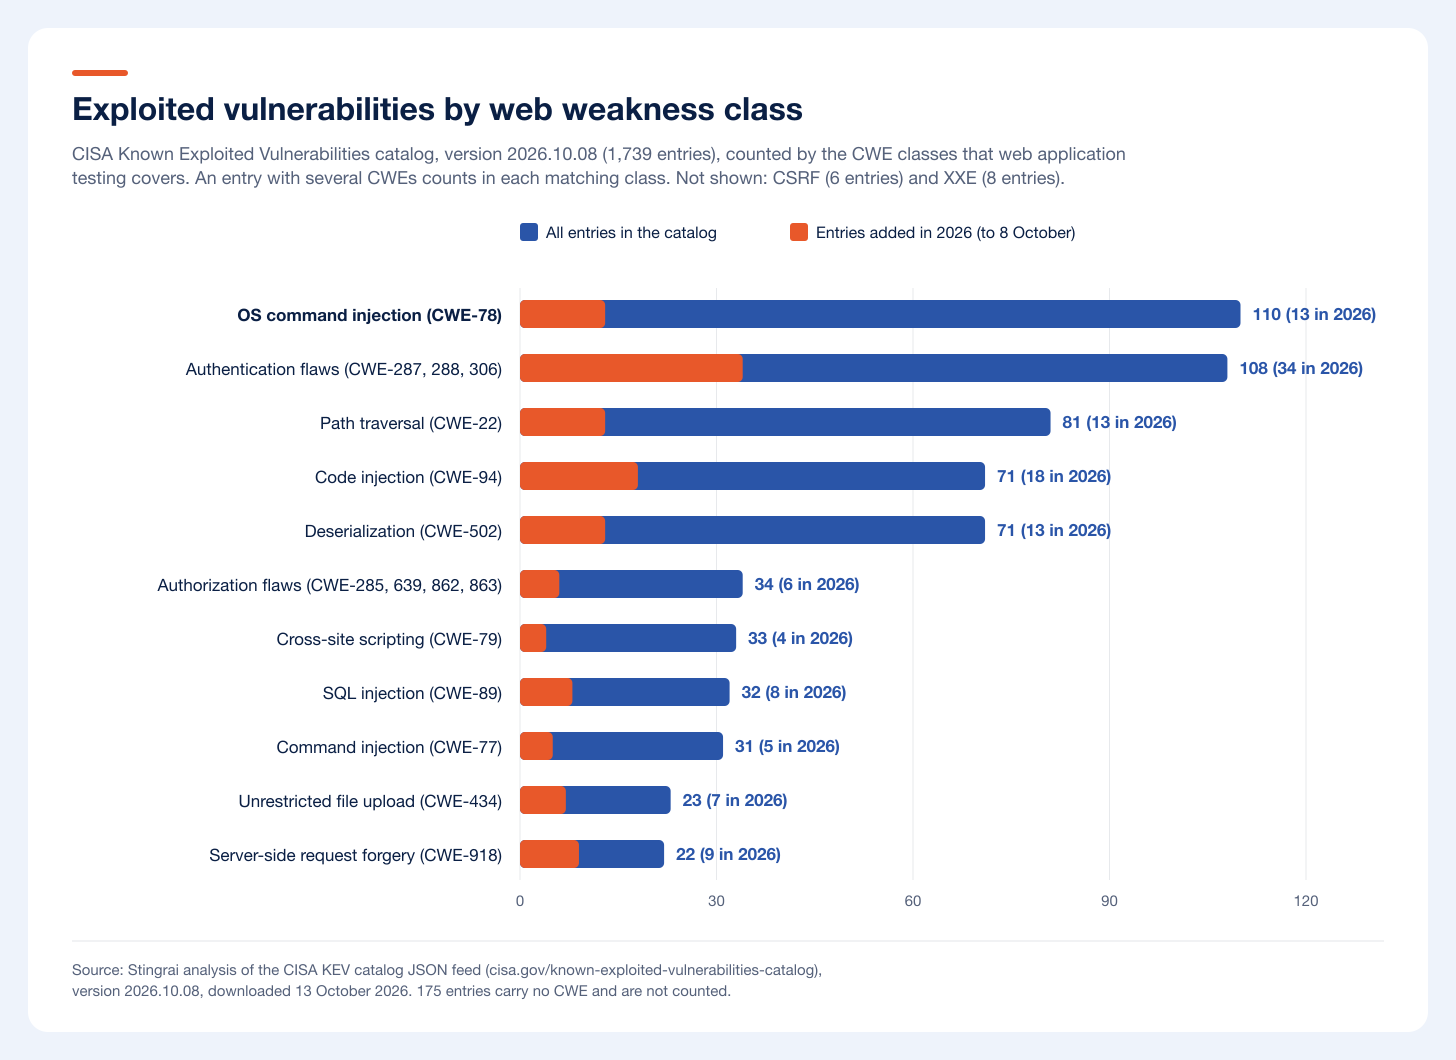
Figure 3: CISA KEV entries by web weakness class, catalog version 2026.10.08, with 2026 additions in orange; CSRF (6) and XXE (8) are not shown. Source: Stingrai analysis of the CISA KEV catalog, downloaded 13 October 2026.
This page keeps API and all-software CVE data to a pointer: see API Security Statistics 2026 and Vulnerability Statistics 2026.
What penetration tests find in web applications
In Stingrai's State of Penetration Testing 2026, the 40 web application tests produced 768 verified findings, a median of 8 per test, with 54% rated High or Critical (internal network tests: 92%). The web class mix is led by authentication and session (28.1%), then misconfiguration and hardening (14.2%), information disclosure (12.5%), broken access control (9.9%), injection (8.2%) and IDOR (7.9%). Outdated software, 56.9% of internal network findings, does not reach the web application top six.
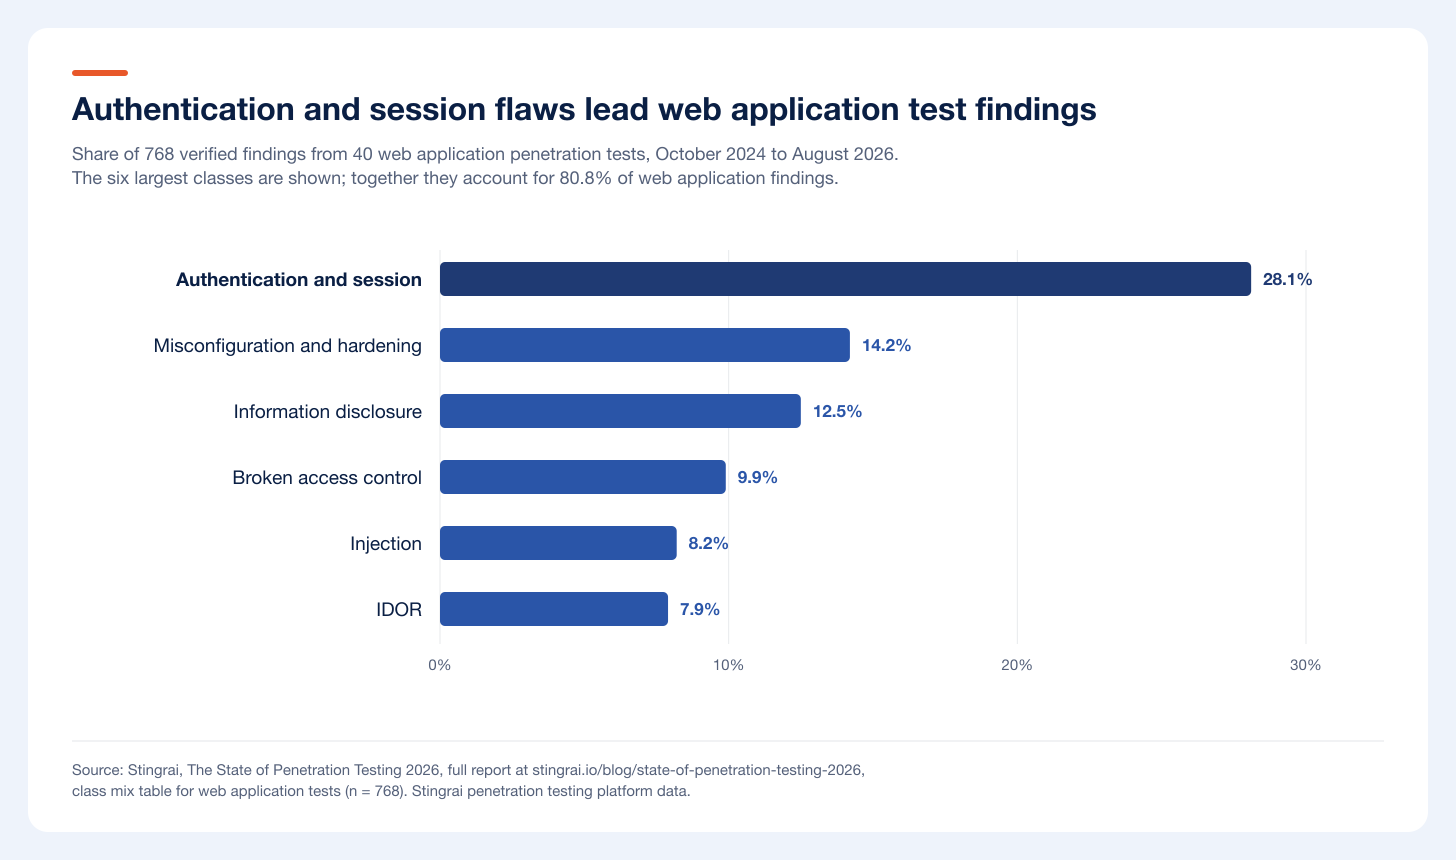
Figure 4: Share of 768 verified findings from 40 web application penetration tests by class, October 2024 to August 2026. Source: Stingrai, State of Penetration Testing 2026.
Counted per test, 70% of the 40 web application tests surfaced at least one High or Critical authentication or authorization finding, 48% a High or Critical injection and 40% an injection rated Critical. Each finding needed reproduction evidence, and 9 of 1,216 logged findings were declined as false positives (0.74%). The aggregate tables are free to reuse under CC BY 4.0 from the report page.
Edgescan lists the critical findings its penetration testing service reports that automation alone rarely finds: APIs accessible without authentication or with weak authentication (16% of them), access restriction bypass (14%), business logic weaknesses (11%) and broken access control logic (10%). Cobalt's State of Pentesting Report 2026, a Cyentia Institute analysis of 16,500 penetration tests on nearly 3,000 organizations over five years, rated 12% of all findings high risk, and 32% for AI and LLM applications.
How long web application flaws stay open
Measure | Figure | Population | Source |
|---|---|---|---|
Average time to remediate high or critical application and API vulnerabilities | 54.8 days (device and network: 39) | Edgescan platform, 2025 | Edgescan 2026, p. 20 |
Days the median organization takes to resolve high-risk findings | 39 days | Cobalt dataset, all test types | Cobalt 2026, via its blog |
Half-life of high-risk findings, top versus bottom performers | 10 versus 249 days | Cobalt dataset | Cobalt 2026, via Cyentia |
Flaw half-life, all scan types (third-party code) | 243 days (358) | 1.6 million applications | Veracode 2026, via Cyentia |
Organizations with security debt (flaws open over a year) | 82% | Veracode dataset | Veracode 2026 |
Critical vulnerabilities still open after 180 days (critical and high in one p. 8 callout) | 32% | Indusface customers | Indusface 2026 |
KEV vulnerabilities fully remediated; median days | 26%; 43 days | 13,000+ organizations | Verizon 2026 DBIR, p. 17 |
Median days to resolve Critical versus High, tracked subset | 10.5 versus 38.0 | 163 findings, all test types | Stingrai 2026 |
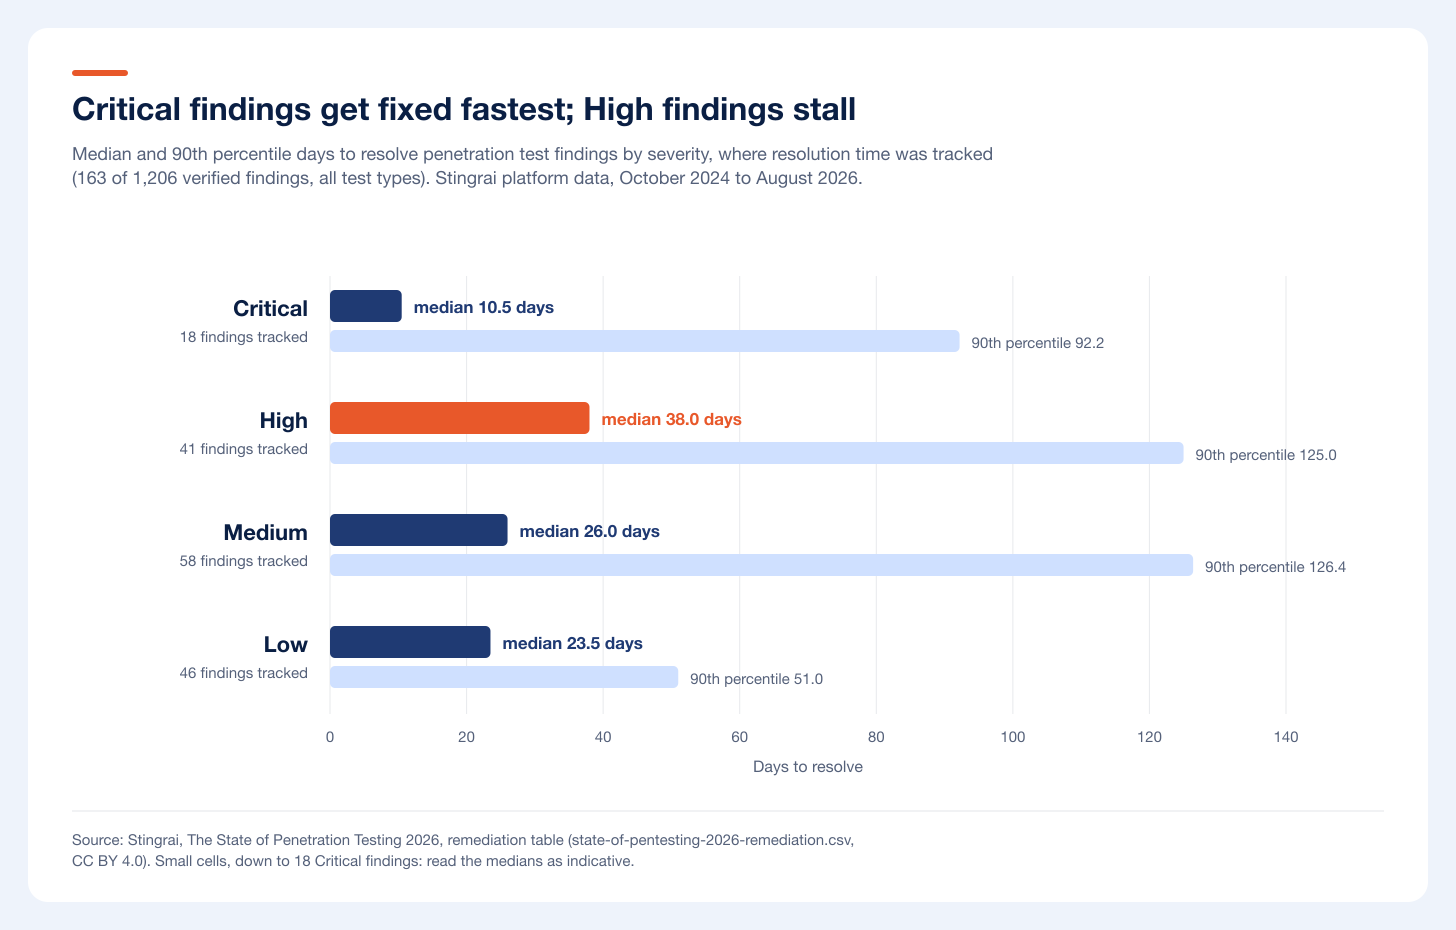
Figure 5: Median and 90th percentile days to resolve findings by severity, where resolution time was tracked (163 findings, all test types). Source: Stingrai, State of Penetration Testing 2026, remediation table.
Where resolution was tracked, Stingrai's Critical findings closed in a median 10.5 days but High findings took 38.0, slower than Medium (26.0) and Low (23.5), and the slowest tenth ran past 120 days, beyond any 30-day retest window. Populations differ across these sources, so compare each figure only with its own baseline.
What this means for defenders
Test the application signed in, as every role. Access control and IDOR flaws, and many session flaws, only show up when the tester holds sessions for different roles and tenants.
Treat authorization as its own test. Broken access control leads OWASP, missing authorization rose to fourth in the CWE Top 25, and scanners rarely model who may do what, which is why scanners miss BOLA and IDOR.
Patch internet-facing frameworks and plugins in hours. Most vulnerabilities X-Force tracked in 2025 needed no authentication, and heavily targeted WordPress flaws were first exploited in a weighted median of 5 hours.
Put a deadline on High, not only Critical. Set a service level for High findings and size retest windows to the 90th percentile, not the median.
Test when the application changes. Keep an annual human-led test as the baseline and add tests after significant releases, or continuous testing for weekly releases.
Where Stingrai fits. Stingrai is a global CREST-accredited penetration testing services company founded in Toronto, Canada in 2021, trusted by companies from startups to enterprises to meet audit requirements for SOC 2, ISO 27001, CMMC, PCI DSS and HIPAA. OSCE³, OSWE, OSEP, CREST CRT certified pentesters, who are also world-class security researchers and bug bounty hunters. Choose from fully human-led or hybrid (AI agents plus human penetration testers) engagements across web, API, mobile, AI and LLM, cloud, network, Active Directory and social engineering penetration tests and red team engagements. Its web application penetration testing is human-led: two named penetration testers from a team holding OSCE³, OSWE, OSEP, CREST CRT and CISSP certifications, with 18 published CVEs across the team, test black, grey or white box, signed in across every user role, with role-based authorization testing for IDOR and broken access control alongside business logic, injection and session handling. Every confirmed finding, at every severity, is posted to the PTaaS platform the same day it is confirmed, with a working proof of concept, retesting is included, and every human-led and hybrid report ships with an attestation letter, as a one-time annual test or a continuous program. For one web application and associated APIs there are two fixed packages: the Autonomous Pentest by Snipe, Stingrai's autonomous agent for black-box and white-box testing that hunts IDOR, business logic and authorization flaws and opens AutoFix pull requests, at US$3,000 per assessment or US$650 per month, and the Hybrid Pentest, in which Snipe and penetration testers test the application together, at US$6,800 per assessment or US$1,275 per month (pricing). Other scopes are quoted per engagement.
How to cite this page
Stingrai Research Team. "Web Application Security Statistics 2026: Attacks, Vulnerabilities and Fix Times." Stingrai, 13 October 2026. https://www.stingrai.io/blog/web-application-security-statistics-2026
Cite single figures to their primary source; cite the NVD and KEV counts, which are Stingrai's own, to this page with the date 13 October 2026.
Frequently Asked Questions
What are the most important web application security statistics in 2026?
Exploitation of public-facing applications was the most common initial access vector in IBM X-Force's 2025 incident data, at 40% of cases, and the Verizon 2026 DBIR put vulnerability exploitation at 31% of known initial access vectors, up from 20%. In Stingrai's 40 web application penetration tests, 54% of findings were High or Critical and 70% of tests surfaced a High or Critical authentication or authorization finding.
How do attackers break into web applications?
Mostly with stolen credentials and unpatched vulnerabilities. In the Verizon 2026 DBIR's Basic Web Application Attacks pattern, use of stolen credentials appeared in 56% of breaches and vulnerability exploitation in 53%. IBM X-Force found that 56% of the vulnerabilities it tracked in 2025 could be exploited without authentication.
What share of breaches involve web application attacks?
The Verizon 2026 DBIR classed 2,281 of more than 22,000 confirmed breaches, about 10%, as Basic Web Application Attacks. Verizon notes the pattern is trending down in favor of the more complex System Intrusion pattern, where web applications are a growing attack vector, and IBM X-Force put exploitation of public-facing applications at 40% of its 2025 cases.
What is the most common web application vulnerability?
It depends on the lens. In Stingrai's web application penetration tests, authentication and session flaws were the largest class at 28.1% of findings. In the CVE record, cross-site scripting is first in the 2025 CWE Top 25. Among critical and high findings on public-facing web applications in Edgescan's data, SQL injection led at 37.18%. As a risk category, broken access control is first in the OWASP Top 10:2025.
What is in the OWASP Top 10 for 2025?
A01 Broken Access Control, A02 Security Misconfiguration, A03 Software Supply Chain Failures, A04 Cryptographic Failures, A05 Injection, A06 Insecure Design, A07 Authentication Failures, A08 Software or Data Integrity Failures, A09 Security Logging and Alerting Failures and A10 Mishandling of Exceptional Conditions. Stingrai's OWASP Top 10 guide explains each category.
How long does it take to fix web application vulnerabilities?
Edgescan measured an average of 54.8 days to remediate high and critical application and API vulnerabilities in 2025, and the median organization in Cobalt's 2026 report takes 39 days to resolve high-risk findings. In Stingrai's data across all test types, where resolution was tracked, Critical findings closed in a median 10.5 days and High findings in 38.
How much does a web application breach cost?
IBM's Cost of a Data Breach Report 2026 puts the average cost of a breach that began by exploiting a public-facing application at USD 4.68 million, below the USD 4.99 million global average. The study covers 602 breached organizations and uses a non-statistical sample, so treat the figure as an indicator.
How often should a web application be penetration tested?
At least once a year and after significant changes, with continuous testing for applications that release often. In Stingrai's dataset, 92.7% of penetration tests surfaced at least one High or Critical finding. Stingrai's web application penetration testing is available as a one-time annual test or a continuous program.
Where can I get web application security data for my own research?
Stingrai publishes the aggregate tables behind its State of Penetration Testing 2026 under CC BY 4.0 on the report page. The NVD CVE API, the CISA KEV feed, the Verizon DBIR and the OWASP Top 10 data are public.
Related reading
The State of Penetration Testing 2026: the full report behind the Stingrai figures.
Why API scanners miss BOLA and IDOR: the case for authorization testing.
References
Verizon. _2026 Data Breach Investigations Report._ May 2026. https://www.verizon.com/business/resources/T6a9/reports/2026-dbir-data-breach-investigations-report.pdf
IBM X-Force. _Threat Intelligence Index 2026._ 25 February 2026. https://www.ibm.com/think/premium/threat-intelligence-report-access-vectors
Google Mandiant. _M-Trends 2026._ 23 March 2026. https://cloud.google.com/blog/topics/threat-intelligence/m-trends-2026
IBM. _Cost of a Data Breach Report 2026._ July 2026. https://www.ibm.com/reports/data-breach
Cloudflare. _Radar 2025 Year in Review._ 15 December 2025. https://blog.cloudflare.com/radar-2025-year-in-review/
Indusface. _State of Application Security 2026._ April 2026. https://www.indusface.com/wp-content/uploads/2026/04/global-appsec-report-2026.pdf
OWASP. _OWASP Top 10:2025._ December 2025. https://owasp.org/Top10/2025/0x00_2025-Introduction/
MITRE and CISA. _2025 CWE Top 25 Most Dangerous Software Weaknesses._ 11 December 2025. https://cwe.mitre.org/top25/archive/2025/2025_cwe_top25.html
CISA. _CISA Vulnerability Review, Fiscal Years 2024 and 2025._ August 2026. https://www.cisa.gov/sites/default/files/2026-08/cisa-vulnerability-review-fy-2024-2025-508.pdf
CISA. _Known Exploited Vulnerabilities Catalog,_ version 2026.10.08. https://www.cisa.gov/known-exploited-vulnerabilities-catalog
NIST. _National Vulnerability Database CVE API 2.0._ Queried 13 October 2026. https://nvd.nist.gov/developers/vulnerabilities
Edgescan. _2026 Vulnerability Statistics Report._ April 2026. https://info.edgescan.com/hubfs/2026%20Vulnerability%20Stats%20Report.pdf
Veracode and Cyentia Institute. _State of Software Security 2026._ 24 February 2026. https://www.cyentia.com/publication/2026-state-of-software-security/ (summary) and Veracode's announcement, https://www.veracode.com/veracode-2026-state-of-software-security-report-reveals-four-out-of-five-organizations-are-drowning-in-security-debt/
Cobalt and Cyentia Institute. _State of Pentesting Report 2026._ April 2026. https://www.cyentia.com/publication/2026-state-of-pentesting-report/ and https://www.cobalt.io/blog/top-15-statistics-2026-state-of-pentesting-report
Datadog. _State of DevSecOps 2026._ 26 February 2026. https://www.datadoghq.com/state-of-devsecops/
Patchstack. _State of WordPress Security in 2026._ 25 February 2026. https://patchstack.com/whitepaper/state-of-wordpress-security-in-2026/
Stingrai. _The State of Penetration Testing 2026._ August 2026. https://www.stingrai.io/reports/state-of-penetration-testing-2026
Talk to Stingrai
A test that signs in as every role finds the authorization and session flaws in these statistics. Stingrai's penetration testers can scope a one-time or continuous test of your web application and associated APIs, with retesting included. Request a quote, see pricing or estimate a budget with the pentest cost calculator.