




Attackers launched 150 billion API attacks between January 2023 and December 2024, and Akamai's State of Apps and API Security 2025 report now describes APIs as the primary target of web attacks. The pressure did not ease in 2025: the average number of daily API attacks per organization rose 113% year over year, and 87% of surveyed organizations reported an API-related security incident, according to Akamai's 2026 Apps, APIs, and DDoS State of the Internet report. Insecure APIs and automated abuse now cost businesses up to US$186 billion a year, of which up to US$87 billion traces to insecure APIs alone, per Imperva and the Marsh McLennan Cyber Risk Intelligence Center. The pattern behind these numbers is consistent: applications have been rebuilt around APIs faster than security teams can inventory, authorize, and monitor them.
Three forces define the 2026 picture. Volume: API attack traffic is growing at double- and triple-digit rates while APIs already make up 57% of the dynamic web traffic Cloudflare processes (Cloudflare 2024 API Security and Management Report). Authorization: the top risks are not exotic exploits but broken access control, with 99% of organizations reporting an API security issue in the past year and 80% of observed attack attempts mapping to the OWASP API Security Top 10 (Salt Security State of API Security Report Q1 2025). Visibility: roughly a third of API endpoints are undocumented "shadow" APIs, and only 10% of organizations run a formal API governance program (Cloudflare, 2024; Salt Security, 2025). This page is written for CISOs, security engineers, API platform owners, and the journalists who cover them.
This post is the Stingrai research team's canonical 2026 reference for API security statistics. It aggregates figures from seven primary publishers, so a writer covering the topic does not have to chase each report: Akamai, Salt Security, Imperva (a Thales company), Cloudflare, Wallarm, OWASP, and the Traceable and Ponemon Institute studies. Lead figures draw on full-year 2025 telemetry and 2026 reporting, the freshest available. Where a metric's most recent primary release is older, for example Cloudflare's API traffic-share study or the Traceable and Ponemon breach survey, the report year is stated next to the number so nothing reads as newer than it is. Every figure below links back to its primary publisher so any claim can be audited inline.
Key API security statistics at a glance (2026)
API attack volume (2023 to 2024): 150 billion API attacks recorded (Akamai, State of Apps and API Security 2025).
API attack growth (2025 vs 2024): average daily API attacks per organization up 113% year over year (Akamai, 2026 Apps, APIs, and DDoS State of the Internet).
Organizations hit (2025): 87% reported an API-related security incident (Akamai, 2026 SOTI).
API security issues (past 12 months): 99% of organizations experienced at least one (Salt Security, State of API Security Q1 2025).
API-related data breach (past two years): 60% of organizations suffered one (Traceable and Ponemon Institute, 2023).
Cost of insecure APIs: up to US$87 billion a year, part of up to US$186 billion from APIs and automated abuse combined (Imperva and Marsh McLennan, 2024).
APIs as a share of web traffic: 57% of dynamic Internet traffic (Cloudflare, 2024 API Security and Management Report).
Shadow APIs: machine learning found about 31% more API endpoints than organizations self-reported (Cloudflare, 2024).
Most common API attack class (observed): security misconfiguration (OWASP API8) accounted for 54% of observed attacks (Salt Security, 2025); it was also 38% of disclosed API flaws in Q3 2025 (Wallarm).
API governance maturity: only 10% of organizations have an API posture governance strategy in place, and only 15% are confident in the accuracy of their API inventory (Salt Security, 2025).
Key takeaways
APIs are now the primary attack surface, not a niche one. Akamai recorded 150 billion API attacks across 2023 and 2024 and states plainly that APIs "have become the primary attack surface" (Akamai, 2026 SOTI). Treating API security as a subset of web application security understates the exposure.
The dominant risks are authorization flaws, not memory bugs. Broken Object Level Authorization (BOLA) leads the OWASP API Top 10, and authorization issues (BOLA plus Broken Function Level Authorization) made up 28% of disclosed API vulnerabilities in Q3 2025 (Wallarm). These are logic flaws that automated scanners consistently miss.
Attackers are already inside the front door. 95% of API attacks over the past 12 months came from authenticated sources, and 98% of attempts targeted external-facing APIs (Salt Security, 2025). Authentication is necessary but far from sufficient.
You cannot secure what you cannot see. About a third of API endpoints are shadow APIs beyond the official inventory (Cloudflare, 2024), while only 10% of organizations run formal API governance (Salt Security, 2025).
AI has widened the API attack surface. Wallarm tied the majority of new AI-related vulnerabilities to APIs and recorded a 270% jump in Model Context Protocol (MCP) issues in a single quarter (Wallarm, Q3 2025). Every new AI agent and integration is another API to secure.
Methodology
This reference aggregates only primary publishers, defined here as the organization that produced the data rather than a news outlet repeating it. The sources are: Akamai's State of Apps and API Security 2025 (published April 2025, telemetry January 2023 to December 2024) and 2026 Apps, APIs, and DDoS State of the Internet report (published March 2026, covering 2025); the Salt Security (Salt Labs) State of API Security Report Q1 2025 (published February 2025); Imperva's Economic Impact of API and Bot Attacks, produced with the Marsh McLennan Cyber Risk Intelligence Center (published September 2024, analyzing more than 161,000 incidents); the Cloudflare 2024 API Security and Management Report (published January 2024, traffic window October 2022 to August 2023); Wallarm's Q3 2025 and annual 2025 API ThreatStats reports; the OWASP API Security Top 10, 2023 edition; and the Traceable and Ponemon Institute API security studies (2023 and 2024).
The research pass closed on 21 August 2026. Every source URL was retrieved and confirmed live during that pass, and each figure was matched to the number as printed by its publisher. Figures that could not be traced to a named primary publisher on at least one verification pass were dropped rather than estimated, including a widely repeated market projection that no current primary statement could confirm. Survey-based figures (Salt Security, Traceable and Ponemon) reflect self-reported practitioner responses; telemetry-based figures (Akamai, Cloudflare, Imperva, Wallarm) reflect observed traffic and disclosed vulnerabilities. The two measure different things and are labeled as such throughout.
What percentage of attacks target APIs?
There is no single figure for the share of all cyberattacks that hit APIs, but the primary telemetry points in one direction: APIs have moved from a secondary concern to the main event. Akamai's 2026 State of the Internet report states that APIs "have become the primary attack surface," and its 2025 report counted 150 billion API attacks across 2023 and 2024 alongside 311 billion web attacks in 2024 overall.
The traffic mix explains why. APIs already account for 57% of the dynamic Internet traffic Cloudflare processes, outpacing traditional browser-driven web traffic (Cloudflare, 2024). Where the traffic goes, the attackers follow. Within API attacks specifically, 98% of attempts targeted external-facing APIs and 95% came from authenticated sources (Salt Security, 2025), which means the typical API attack is not an anonymous probe of an internal service but an authorized-looking request against a public endpoint.
How fast are API attacks growing?
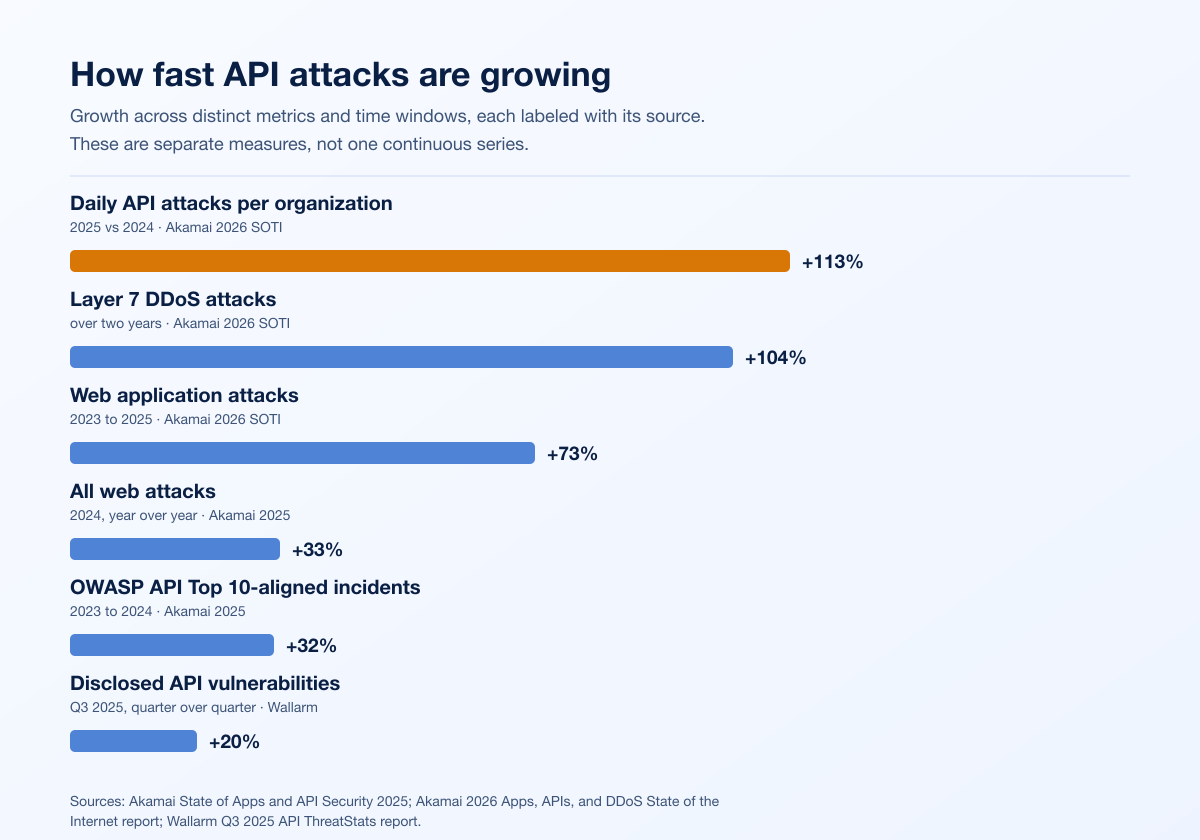
Every primary source that tracks API attack volume reports sharp growth. The clearest single figure comes from Akamai's 2026 SOTI report: the average number of daily API attacks per organization rose 113% year over year from 2024 to 2025, more than doubling. Over a longer horizon, Akamai reported that web application attacks climbed 73% between 2023 and 2025, and that all web attacks rose 33% in 2024 to 311 billion.
Disclosed vulnerabilities tell a parallel story. Wallarm counted 1,602 API-related vulnerabilities in Q3 2025, a 20% increase over the previous quarter, and reported that OWASP API Top 10-aligned incidents tracked by Akamai rose 32% (Wallarm, Q3 2025; Akamai, 2025).
Metric | Figure | Period | Source |
|---|---|---|---|
Daily API attacks per organization | +113% year over year | 2025 vs 2024 | Akamai, 2026 SOTI |
API attacks recorded | 150 billion | Jan 2023 to Dec 2024 | Akamai, 2025 |
All web attacks | 311 billion (+33%) | 2024 | Akamai, 2025 |
Web application attacks | +73% | 2023 to 2025 | Akamai, 2026 SOTI |
OWASP API Top 10-aligned incidents | +32% | 2023 to 2024 | Akamai, 2025 |
Disclosed API vulnerabilities | 1,602 (+20% QoQ) | Q3 2025 | Wallarm |
Layer 7 DDoS attacks | +104% | over two years | Akamai, 2026 SOTI |
Table 1: API attack and vulnerability growth signals, 2024 to 2026. Metrics measure different things (observed attacks, recorded volume, disclosed vulnerabilities) over different windows and are not a single continuous series. Sources: Akamai State of Apps and API Security 2025, Akamai 2026 Apps, APIs, and DDoS State of the Internet report, Wallarm Q3 2025 API ThreatStats.
Two structural drivers sit behind the curve. The first is the sheer growth of API estates: 30% of organizations saw their number of managed APIs grow 51% to 100% in a single year, and a further 25% saw growth above 100% (Salt Security, 2025). The second is AI. Wallarm attributed the majority of newly disclosed AI-related vulnerabilities to APIs and logged a 270% quarter-over-quarter surge in Model Context Protocol issues, the emerging standard that lets AI agents call tools and data over APIs.
How common are API security breaches?
API security problems are close to universal, and outright breaches are common. In 2025, 87% of organizations reported an API-related security incident (Akamai, 2026 SOTI), and 99% experienced at least one API security issue in the prior 12 months (Salt Security, 2025). Those figures cover incidents broadly, from misconfiguration to abuse.
Narrowing to confirmed data breaches, the Traceable and Ponemon Institute study found that 60% of organizations had a data breach caused by an API exploitation in the prior two years, and among breached organizations, 23% had suffered six or more API exploits over that period. Repeat exposure is the norm, not the exception, which reflects the reality that a single unfixed authorization flaw can be exploited again and again across an object space.
The severity is not abstract. 34% of the API security issues organizations reported involved sensitive data exposure (Salt Security, 2025), which is the outcome that turns an API bug into a regulatory and reputational event.
What is the most common API vulnerability?
Two answers hold depending on whether you count what attackers do or what researchers disclose, and both point at the same short list.
By observed attack volume, security misconfiguration (OWASP API8) leads: it accounted for 54% of the attacks Salt observed, and 80% of all attack attempts mapped to the OWASP API Security Top 10 (Salt Security, 2025). By disclosed vulnerabilities, Wallarm's Q3 2025 data agrees on misconfiguration (API8) as the single largest class at 38% of all API flaws, with authorization issues, Broken Object Level Authorization (API1) plus Broken Function Level Authorization (API5), close behind at 28% (Wallarm).
Authorization is the throughline. BOLA sits at the top of the OWASP API Security Top 10 because it is both easy to introduce and hard to detect automatically: it depends on whether a given user should be allowed to access a specific object, which a scanner cannot infer without understanding the application's ownership model. That is exactly why authorization flaws keep surfacing across breach data even as tooling improves.
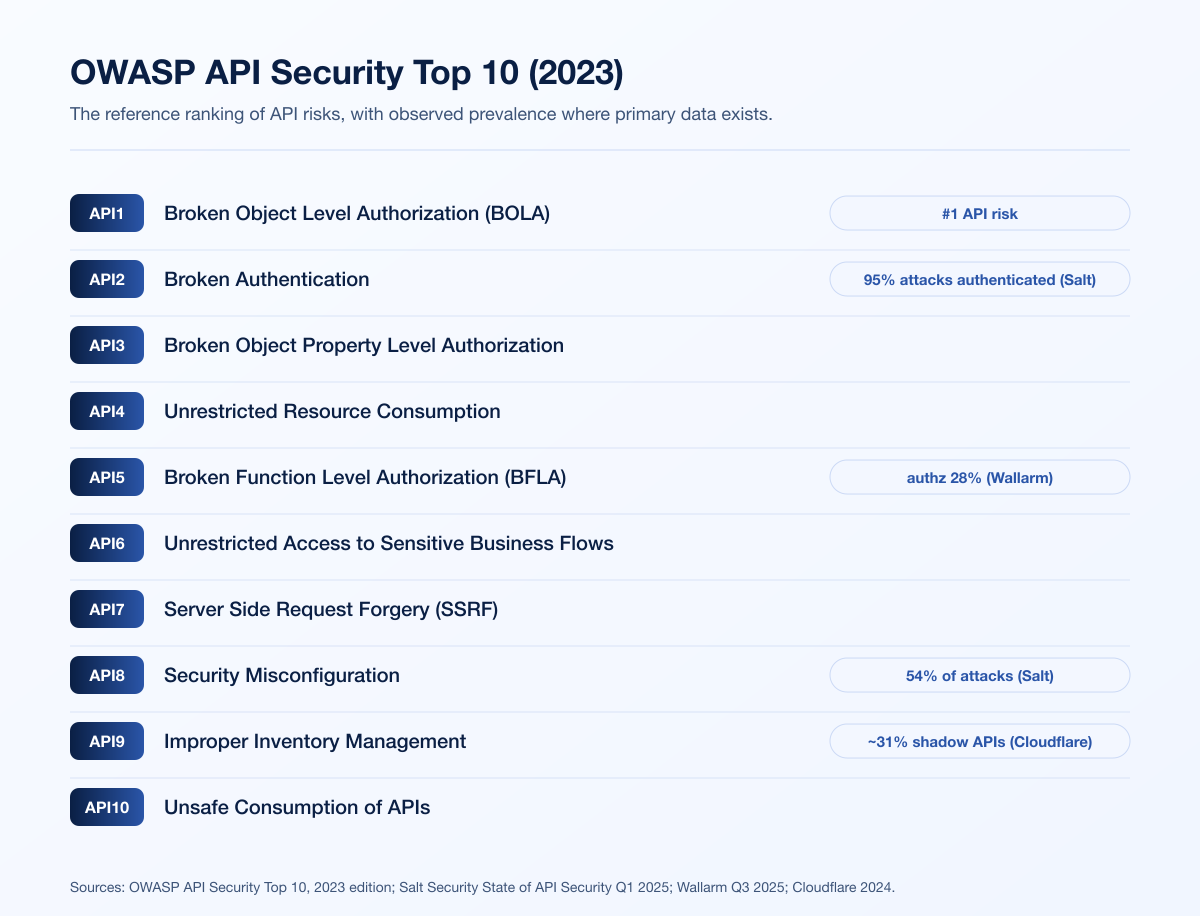
Rank | Category | What it is | Observed prevalence signal |
|---|---|---|---|
API1 | Broken Object Level Authorization (BOLA) | User accesses objects they should not, by manipulating IDs | Top OWASP API risk; part of the 28% authorization share of disclosed flaws (Wallarm, Q3 2025) |
API2 | Broken Authentication | Weak or broken login, token, or session handling | 95% of API attacks came from authenticated sources (Salt, 2025) |
API3 | Broken Object Property Level Authorization | Over-exposed or over-writable object fields (mass assignment) | Consolidated in the 2023 edition from data exposure and mass assignment |
API4 | Unrestricted Resource Consumption | Missing rate and resource limits enabling abuse or DoS | Ties to Layer 7 DDoS up 104% over two years (Akamai, 2026 SOTI) |
API5 | Broken Function Level Authorization (BFLA) | Users reach admin or privileged functions | Part of the 28% authorization share of disclosed flaws (Wallarm, Q3 2025) |
API6 | Unrestricted Access to Sensitive Business Flows | Automated abuse of legitimate flows (checkout, signup) | Bots accounted for 30% of all API attacks (Imperva, 2024) |
API7 | Server Side Request Forgery (SSRF) | API fetches an attacker-controlled URL | Recurring class in disclosed API CVEs (Wallarm) |
API8 | Security Misconfiguration | Insecure defaults, verbose errors, missing hardening | 54% of observed attacks (Salt, 2025); 38% of disclosed flaws (Wallarm, Q3 2025) |
API9 | Improper Inventory Management | Undocumented, deprecated, or shadow endpoints | ~31% more endpoints found than inventoried (Cloudflare, 2024) |
API10 | Unsafe Consumption of APIs | Blindly trusting data from third-party APIs | Organizations connect an average of 131 third-party APIs (Ponemon, 2024) |
Table 2: The OWASP API Security Top 10, 2023 edition, with real-world prevalence signals from primary telemetry and survey data. Category names: OWASP API Security Top 10 (2023). Prevalence signals as attributed. A dash indicates no clean single-source percentage.
Where API attacks and flaws concentrate, by class
Class or measure | Share | Basis | Source |
|---|---|---|---|
Security misconfiguration (API8) | 54% | of observed API attacks | Salt Security, 2025 |
Attempts mapping to OWASP API Top 10 | 80% | of observed attack attempts | Salt Security, 2025 |
Attacks from authenticated sources | 95% | of API attacks | Salt Security, 2025 |
Attacks on external-facing APIs | 98% | of attack attempts | Salt Security, 2025 |
Security misconfiguration (API8) | 38% | of disclosed API vulnerabilities | Wallarm, Q3 2025 |
Authorization (API1 BOLA + API5 BFLA) | 28% | of disclosed API vulnerabilities | Wallarm, Q3 2025 |
Bot-driven | 30% | of all API attacks | Imperva, 2024 |
Table 3: Breach and vulnerability share by API class. Salt figures reflect observed attacks; Wallarm figures reflect disclosed vulnerabilities; Imperva reflects incident analysis. Because they measure different populations, the percentages are not additive across rows.
How much do API attacks cost?
The most cited economic figure comes from Imperva and the Marsh McLennan Cyber Risk Intelligence Center, which analyzed more than 161,000 unique cybersecurity incidents. Insecure APIs and automated bot abuse together cost businesses up to US$186 billion a year. Broken out, insecure APIs alone account for up to US$87 billion in annual losses, automated bot attacks for up to US$116 billion, and automated abuse of APIs specifically for up to US$17.9 billion. (These are separate upper-bound estimates for overlapping problems and should not be summed.)
Concentration matters. Companies with revenue of at least US$100 billion see up to 26% of all their security incidents tied to API or bot threats, versus roughly 12% on average, because larger enterprises expose more APIs: the report puts the average enterprise at 613 API endpoints in production (Imperva, 2024). Survey data lines up with the telemetry. Organizations that run API discovery reported managing an average inventory of 1,099 APIs and dedicating about US$4.2 million a year to API security (Traceable and Ponemon, 2023).
Beyond direct losses, API security concerns now slow the business: 55% of organizations said they delayed the rollout of a new application because of API security worries (Salt Security, 2025). Insecure APIs are a tax on shipping, not only a cost of cleanup.
How big is the shadow and unmanaged API problem?
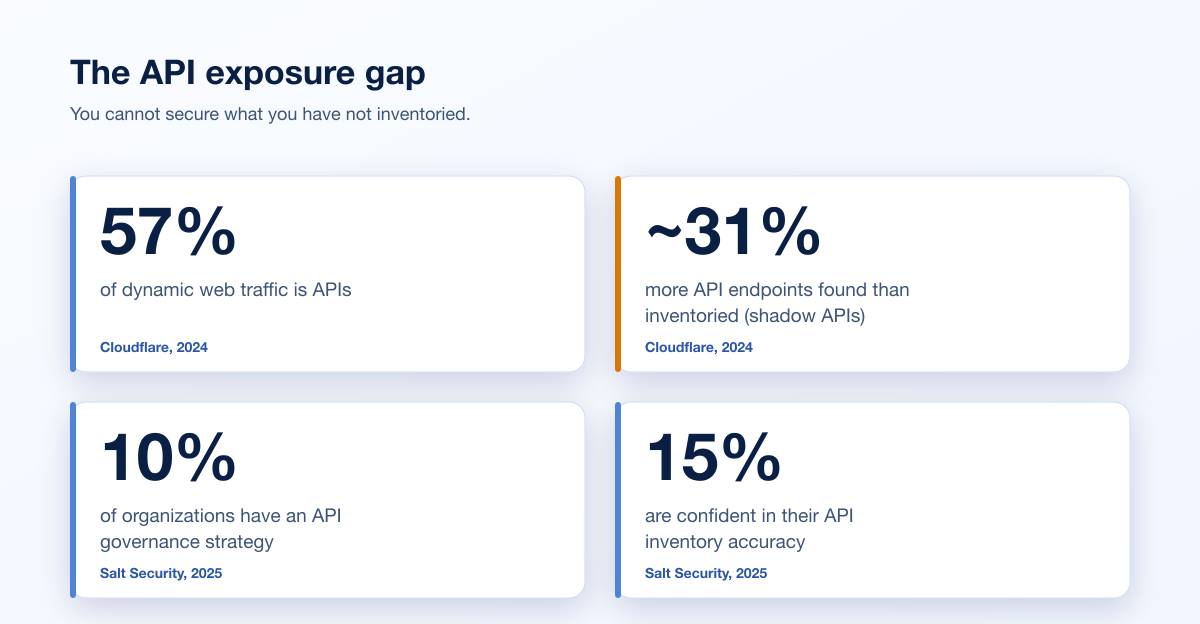
Inventory is the quiet failure underneath the attack statistics. Cloudflare's machine-learning discovery found about 31% more API endpoints than organizations had catalogued themselves, meaning roughly a third of the API surface is shadow infrastructure that no one is deliberately defending (Cloudflare, 2024). Improper Inventory Management is API9 in the OWASP list for exactly this reason.
Governance is thin. Only 10% of organizations have an API posture governance strategy in place, only 15% are strongly confident in the accuracy of their API inventory, and 58% monitor their APIs less than daily (Salt Security, 2025). The third-party dimension compounds it: organizations connect an average of 131 external APIs (Traceable and Ponemon, 2024), each one a dependency governed by someone else's security practices and covered by OWASP API10, Unsafe Consumption of APIs.
What this means for your security program
The statistics converge on a single operational conclusion: the API risks that matter most in 2026 are authorization and business-logic flaws, and those are the classes that automated scanners cannot reliably find. A scanner can flag a missing security header or a known CVE, but it cannot know that user A should not be able to read user B's invoice by changing an ID, which is the essence of BOLA and BFLA. Testing that finds these flaws has to reason about ownership, roles, and tenant boundaries the way an attacker does. For the mechanics of why automated tools miss object-level and tenant-isolation flaws, see why automated API scanners miss BOLA and IDOR, and for the API-specific vulnerability classes in GraphQL, see GraphQL API vulnerabilities and common attacks.
Practical priorities that follow from the data:
Inventory first. You cannot test or monitor what you have not catalogued, and about a third of endpoints are shadow APIs. Continuous discovery is the precondition for everything else.
Test authorization directly. BOLA, BFLA, and broken object property-level authorization sit at the top of both the OWASP list and the disclosed-vulnerability data. Multi-account, object-level, and tenant-isolation testing is where the real findings are.
Assume authenticated attackers. With 95% of API attacks coming from authenticated sources, access control has to hold up against valid users abusing their level of access, not just against anonymous traffic.
Cover the AI surface. Every new agent, plugin, and MCP integration is a new API. The fastest-growing vulnerability classes are already AI-adjacent.
Stingrai runs web application and API penetration testing as both one-time and continuous engagements, so teams can validate a release before it ships and keep testing as the API estate changes. Its AI pentesting agent, Snipe, is purpose-built to hunt the complex, high-impact classes that dominate the OWASP API Top 10, including IDOR and BOLA, broken function-level authorization, and business-logic flaws, working concurrently alongside senior human pentesters who direct and extend its testing. If you want that applied to your APIs, request a scoped quote.
Frequently asked questions
How common are API security breaches?
Very common. In 2025, 87% of organizations reported an API-related security incident (Akamai, 2026 State of the Internet report), and 99% experienced at least one API security issue in the prior 12 months (Salt Security, 2025). Narrowing to confirmed data breaches, 60% of organizations had a breach caused by API exploitation in the prior two years (Traceable and Ponemon Institute, 2023).
What is the most common API vulnerability?
Security misconfiguration (OWASP API8) and broken authorization are the two most common, depending on how you measure. Salt Security observed that misconfiguration accounted for 54% of API attacks in 2025, while Wallarm's Q3 2025 disclosure data put misconfiguration at 38% of API flaws and authorization issues (BOLA plus BFLA) at 28% (Salt Security, 2025; Wallarm, Q3 2025). Broken Object Level Authorization (BOLA) sits at the top of the OWASP API Security Top 10.
How much do API attacks cost?
Insecure APIs cost businesses up to US$87 billion a year, part of up to US$186 billion in annual losses from insecure APIs and automated bot abuse combined, based on analysis of more than 161,000 incidents by Imperva and the Marsh McLennan Cyber Risk Intelligence Center (2024). Automated abuse of APIs specifically accounts for up to US$17.9 billion of that.
What percentage of attacks target APIs?
There is no single agreed percentage, but the direction is clear: APIs are now the primary attack surface for web attacks (Akamai, 2026 SOTI), and APIs already make up 57% of dynamic web traffic (Cloudflare, 2024). Akamai recorded 150 billion API attacks across 2023 and 2024, and within API attacks, 98% of attempts targeted external-facing endpoints (Salt Security, 2025).
How fast are API attacks growing?
The average number of daily API attacks per organization rose 113% year over year from 2024 to 2025 (Akamai, 2026 SOTI). Over a longer window, web application attacks grew 73% between 2023 and 2025, and disclosed API vulnerabilities rose 20% quarter over quarter in Q3 2025 (Wallarm).
What is BOLA, and why does it matter so much?
Broken Object Level Authorization (BOLA) is a flaw where an API lets a user access objects that belong to someone else, usually by changing an identifier in the request. It is ranked API1 in the OWASP API Security Top 10 because it is common, easy to introduce, and hard for scanners to detect, since a tool cannot know which user should own which object without understanding the application's data model. Authorization issues including BOLA made up 28% of disclosed API vulnerabilities in Q3 2025 (Wallarm).
How many APIs are shadow or unmanaged?
Roughly a third. Cloudflare's machine-learning discovery found about 31% more API endpoints than organizations self-reported (Cloudflare, 2024), and only 15% of organizations are strongly confident in the accuracy of their API inventory (Salt Security, 2025). Undocumented endpoints fall under OWASP API9, Improper Inventory Management.
Are AI systems increasing API risk?
Yes. AI features are delivered over APIs, so they expand the API attack surface. Wallarm reported that the majority of newly disclosed AI-related vulnerabilities were tied to APIs and recorded a 270% quarter-over-quarter increase in Model Context Protocol (MCP) issues in Q3 2025 (Wallarm). Akamai attributes part of the broader surge in API attacks to rapid AI adoption (Akamai, 2025).
Where can I get the latest API security data?
Go to the primary publishers directly: Akamai's State of the Internet reports, the Salt Security State of API Security Report, Imperva's Economic Impact of API and Bot Attacks, the Cloudflare API Security and Management Report, Wallarm's quarterly API ThreatStats reports, the OWASP API Security Project, and the Traceable and Ponemon Institute studies. Each is linked in the references below with its publication date.
References
Akamai. AI Transformation at Risk: APIs Emerge as the Primary Attack Surface (2026 Apps, APIs, and DDoS State of the Internet report). March 2026. https://www.akamai.com/newsroom/press-release/ai-transformation-at-risk-apis-emerge-as-the-primary-attack-surface-akamai-research-finds. Global telemetry on API attack growth, DDoS, and web application attacks for 2025, including the 113% year-over-year rise in daily API attacks and 87% of organizations reporting an API incident.
Akamai. State of Apps and API Security 2025: How AI Is Shifting the Digital Terrain. April 2025. https://www.akamai.com/newsroom/press-release/akamai-research-web-attacks-up-33-apis-emerge-as-primary-targets. Records 150 billion API attacks (January 2023 to December 2024), 311 billion web attacks in 2024, and a 32% rise in OWASP API Top 10-aligned incidents.
Salt Security (Salt Labs). State of API Security Report Q1 2025. February 2025. https://salt.security/press-releases/salt-labs-state-of-api-security-report-reveals-99-of-respondents-experienced-api-security-issues-in-past-12-months. Practitioner survey and Salt Labs telemetry: 99% experienced an API security issue, 95% of attacks from authenticated sources, 54% of attacks tied to security misconfiguration, and 10% with a governance strategy.
Imperva (a Thales company) and Marsh McLennan Cyber Risk Intelligence Center. The Economic Impact of API and Bot Attacks. September 2024. https://www.imperva.com/company/press_releases/vulnerable-apis-and-bot-attacks-costing-businesses-up-to-186b-annually/. Analysis of more than 161,000 incidents estimating up to US$186 billion in annual losses from insecure APIs and bot abuse, of which up to US$87 billion traces to insecure APIs.
Cloudflare. 2024 API Security and Management Report. January 2024. https://www.cloudflare.com/press-releases/2024/new-cloudflare-report-shows-organizations-struggle-to-identify-and-manage/. Traffic study (October 2022 to August 2023) showing APIs at 57% of dynamic Internet traffic and about 31% more API endpoints discovered than self-reported.
Wallarm. Q3 2025 API ThreatStats Report. October 2025. https://www.prnewswire.com/news-releases/wallarm-releases-q3-2025-api-threatstats-report-api-vulnerabilities-up-20-mcp-risks-surge-270-302598519.html. Disclosed-vulnerability tracking: 1,602 API vulnerabilities in Q3 2025 (up 20%), security misconfiguration at 38% of flaws, authorization issues at 28%, and a 270% surge in Model Context Protocol issues.
OWASP. API Security Top 10, 2023 edition. 2023. https://owasp.org/API-Security/editions/2023/en/0x11-t10/. The reference ranking of the ten most critical API security risks, led by Broken Object Level Authorization (BOLA).
Traceable and Ponemon Institute. The Growing API Security Crisis: A Global Study. September 2023. https://ponemonsullivanreport.com/2023/09/state-of-api-security-2023-global-findings/. Global survey: 60% of organizations had an API-exploitation data breach in the prior two years, and organizations with discovery manage an average of 1,099 APIs.
Traceable and Ponemon Institute. Second Annual Global Study on the Growing API Security Crisis. December 2024. https://ponemonsullivanreport.com/2024/12/the-second-annual-global-study-on-the-growing-api-security-crisis/. Survey of 1,548 practitioners: organizations connect an average of 131 third-party APIs, and only 38% of APIs are continually tested.