




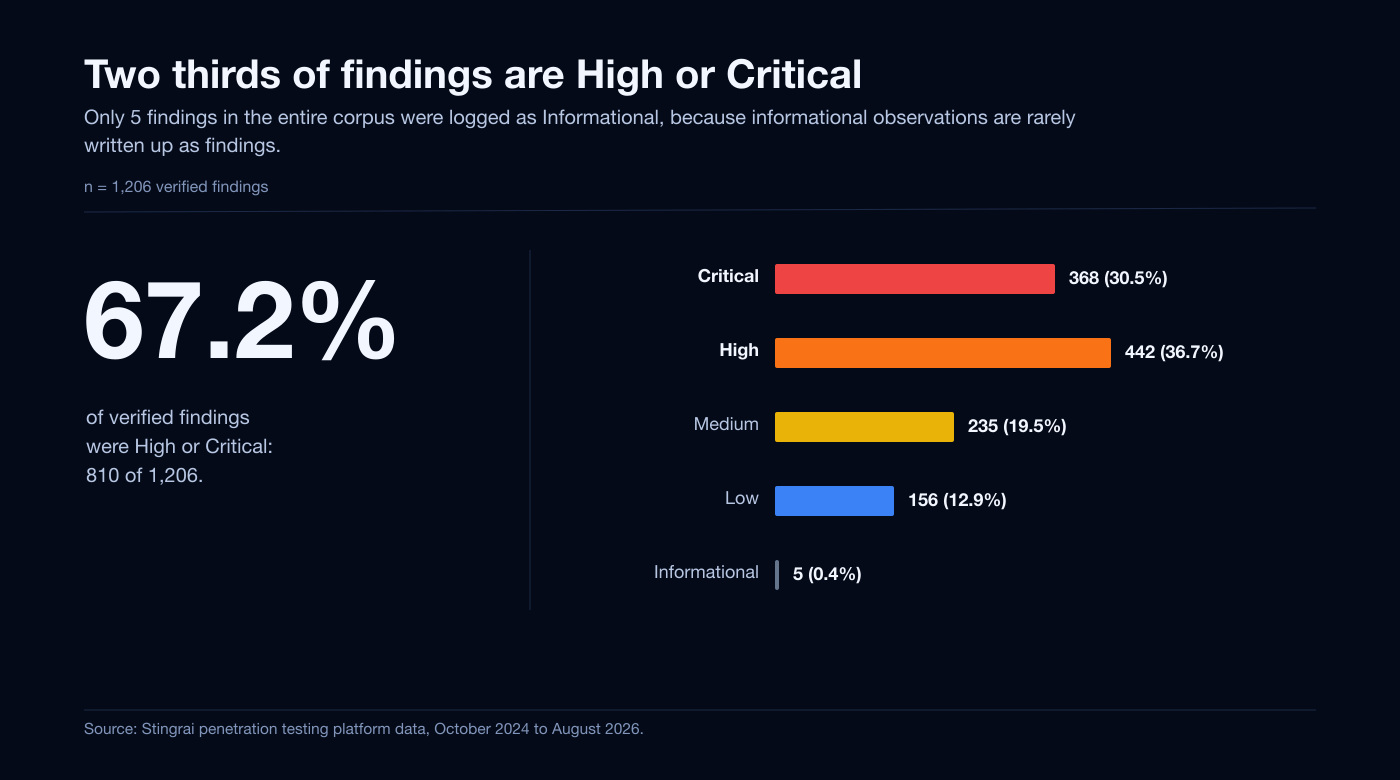
Quick answer: Across 55 penetration tests run between October 2024 and August 2026, Stingrai logged 1,216 findings, of which 1,206 form the verified analysis set. Two thirds of them, 810 findings or 67.2%, were High or Critical. What a penetration test finds splits almost evenly between two kinds of problem: 37.2% of findings fall into classes a scanner could in principle flag, and 35.2% fall into classes that require understanding how the application works. The more useful result is that this mix depends heavily on what is being tested. Outdated software accounts for 56.9% of internal network findings, while web application testing is dominated by authentication and authorization. Nine findings out of 1,216 were declined at review as false positives, a rate of 0.74%.
Everything below comes from one dataset: Stingrai's penetration testing platform, extracted on 29 August 2026. It is a single firm's book of work, not an industry survey, and the limitations say where that matters.
Key findings
Verified findings analysed: 1,206, from 1,216 logged. False positives: 9, or 0.74%.
High and Critical share: 810 of 1,206 verified findings, or 67.2%.
Tests that surfaced a High or Critical: 51 of 55, or 92.7%. A Critical: 38 of 55, or 69.1%.
Largest single vulnerability class: authentication and session, 253 findings or 21.0%, narrowly ahead of outdated or unpatched software at 252 or 20.9%. Largest among severe findings: outdated software, 232 of the 810 High and Critical, or 28.6%.
The mix depends on the test type: outdated software is 56.9% of internal network findings, while authentication and session is 28.1% of web application findings.
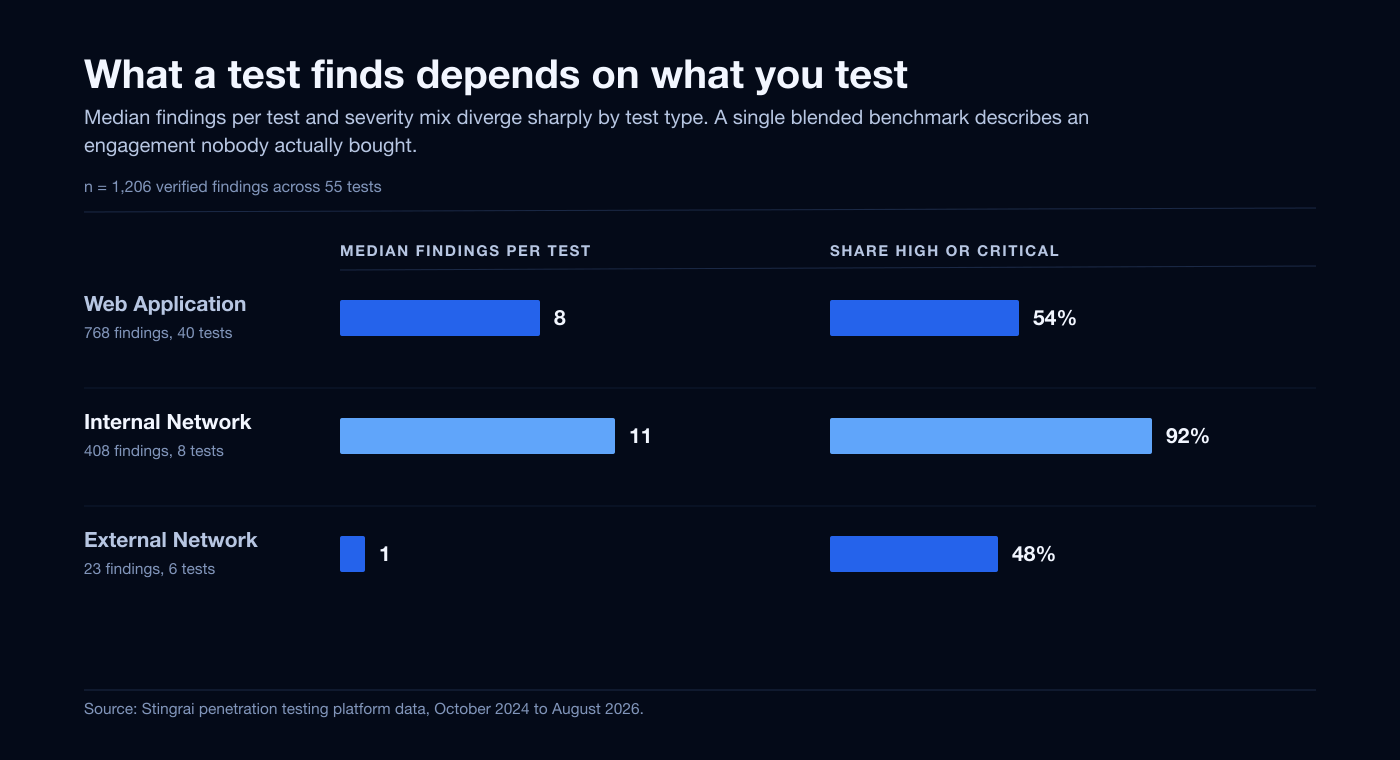
Severity depends on the test type too: 92% of internal network findings were High or Critical, against 54% for web application and 48% for external network.
What earns a Critical is not what earns a High: Critical findings are led by authentication and session at 28.5%, High findings by outdated software at 32.8%. An injection finding was rated Critical 56.5% of the time, the highest conversion of any class.
The odds for a web application test: 70% of the 40 web application tests that produced findings surfaced at least one High or Critical authentication or authorization finding, and 48% surfaced a High or Critical injection.
Scanner-shaped classes: 449 findings, 37.2% of the corpus, and 317 or 39.1% within High and Critical.
Context-dependent classes: 425 findings, 35.2% of the corpus, and 279 or 34.4% within High and Critical.
Median findings per test: 8 across the 55 penetration tests, middle half 5 to 15.
Median time to resolve: 26 days, 90th percentile 121 days, across the 163 findings with a tracked resolution time. Critical findings were resolved fastest, at a median of 10.5 days.
Key takeaways
The single most important number in this report is that there is no single number. What a penetration test finds depends on what is being tested, and the difference is not marginal. Outdated or unpatched software is 56.9% of internal network findings and a rounding error in web application work, where authentication and session issues lead at 28.1%. Any benchmark that pools test types into one average describes an engagement nobody actually bought.
A penetration test is two kinds of work in roughly equal measure, not one tool substituting for another. Just over a third of findings, 37.2%, fall into classes a scanner could in principle flag: outdated components, hardening gaps, exposed services, missing rate limits. Almost the same share, 35.2%, falls into classes no signature can represent: authentication and session handling, broken access control, object-level authorization, business logic.
The corpus-wide result that outdated software dominates the severe findings is largely an internal network effect. Outdated software is 232 of the 810 High and Critical findings, or 28.6%, the largest single block. Read alongside the segmentation, that headline is substantially a statement about internal network estates rather than about application code.
Roughly one severe finding in three involves logic or identity that no scanner models. Authentication and session, authorization and access control, and business logic together make up 279 of 810 High and Critical findings, or 34.4%.
Critical findings are fixed fastest and High findings stall, which is the opposite of the usual assumption. Among the findings with a tracked resolution time, Critical findings closed at a median of 10.5 days while High findings took 38.0. The severity that gets an incident response gets fixed; the one below it queues.
Methodology
Source, window and base. Stingrai's penetration testing platform, the system of record for engagements, findings, review state, and remediation status. Figures were pulled on 29 August 2026 and cover findings logged between 1 October 2024 and 29 August 2026, across 55 penetration tests. Only counts, shares, and percentiles were extracted.
Corpus. 1,216 findings were logged across the 55 penetration tests, after excluding internal demonstration engagements and 7 internal records that were never client findings. Nine of the 1,216 were declined at review as false positives, a rate of 0.74%. Every distribution here is computed over a verified analysis set of 1,206 findings. A finding is verified when a penetration tester has reproduced it and attached evidence, and it has entered a two-stage review: first a team lead, then the engagement partner. Findings still in that queue are included because they carry reproduction evidence; they have not been rejected, only not yet signed off.
One of the 1,206 records is not a vulnerability. It documents a control working correctly, network segmentation verified effective, and it appears in the class table as its own row.
How findings were classified
Every finding was classified by rule-based analysis of its title, applied uniformly across the corpus. The method reads titles only, not full descriptions, which makes it conservative: it under-classifies before it over-classifies. Class shares should be read with that in mind; a full-text pass could shift individual shares by a point or two, but not the overall split, which is driven by the largest and least ambiguous classes.
Limitations
The severity mix reflects what penetration testers judged worth reporting. Informational issues are rarely logged as findings, which is why that category holds only 5 records. Read the severity distribution as the shape of a test's reportable output, not of everything present in a target.
The classification reads titles, not full finding bodies. A full-text pass could shift individual class shares by a point or two, but not the overall split, which is driven by the largest and least ambiguous classes.
Client industry was not recorded. The field is empty for all 67 organizations, so this report offers no sector or vertical breakdown and none should be inferred from it.
Resolution times cover 163 findings, not 1,206, and skew toward clients who manage remediation inside the platform. The by-severity cells are smaller still, down to 18 Critical findings, so read those medians as indicative.
The Snipe comparison rests on 9 engagements and is an observed difference, not a causal finding. Its caveats are stated where it appears.
Mobile testing contributed 7 findings from a single engagement, included in corpus totals but not segmented.
"Pending fix" does not mean "never fixed". 1,014 findings sit at that status, but only 46 were synced to a client ticketing system at all, so the platform cannot see remediation happening in a client's own tracker. Those status counts were extracted over the logged set and sum to 1,214, which is why they are reported as counts and never as a percentage of 1,206.
The mean of 21.9 findings per test misleads on its own. One large engagement produced 223 findings and drags the average well above the median of 8, so the median appears beside it wherever the mean is used.
Seven internal test records were excluded, the only editorial exclusion applied to the corpus.
This is one firm's data. Scope selection, client mix, and methodology all shape what gets found. Treat these as observed figures from a defined book of work, not as industry rates.
Will a penetration test actually find anything?
Across the 55 penetration tests, 51 surfaced at least one High or Critical finding (92.7%) and 38 surfaced at least one Critical (69.1%).
That does not support the claim that every application is riddled with critical flaws. What it supports is narrower and more useful: when a penetration test is run against a real target, it almost always finds something that matters.
What penetration tests actually find
Vulnerability class | Findings | Share |
|---|---|---|
Authentication and session | 253 | 21.0% |
Outdated or unpatched software | 252 | 20.9% |
Security misconfiguration and hardening | 164 | 13.6% |
Information disclosure | 112 | 9.3% |
Injection (SQLi, command, RCE) | 108 | 9.0% |
Broken access control | 85 | 7.0% |
IDOR and object-level authorization | 66 | 5.5% |
Cross-site scripting | 63 | 5.2% |
File upload and path traversal | 26 | 2.2% |
Exposed services and default access | 23 | 1.9% |
Business logic | 22 | 1.8% |
CSRF and cross-origin abuse | 11 | 0.9% |
Denial of service and rate limiting | 10 | 0.8% |
SSRF | 10 | 0.8% |
Control verified effective (not a vulnerability) | 1 | 0.1% |
Total | 1,206 | 100% |
Source: Stingrai penetration testing platform data, October 2024 to August 2026.
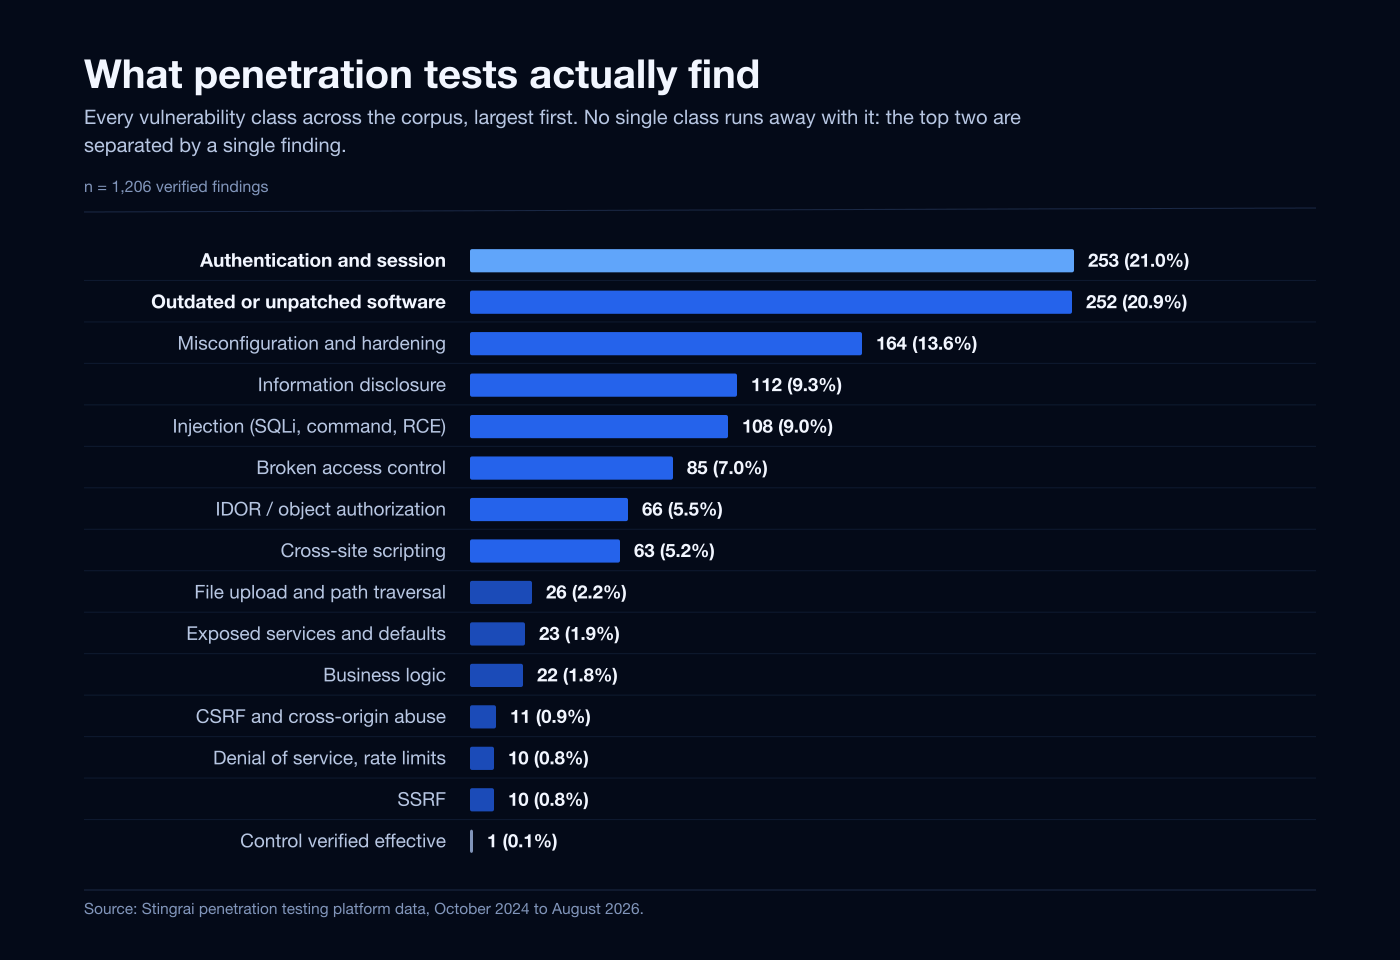
Two things stand out: how close the top two are, authentication and session handling at 21.0% against outdated or unpatched software at 20.9%, separated by a single finding, and how flat the distribution is after that.
Grouping related classes shows the same balance. Configuration, exposure and disclosure comes to 299 findings (24.8%), authentication and session to 253 (21.0%), outdated or unpatched software to 252 (20.9%), and injection and client-side execution to 218 (18.1%), with authorization and access control at 151 (12.5%), business logic at 22 (1.8%) and denial of service at 10 (0.8%). Four groups sit between 18% and 25% of the corpus.
That balance is real, but it is also an average of things that should not have been averaged, which is the subject of the next section.
What a test finds depends on what you test
This is the part most penetration testing reports do not publish. Pooling every engagement into one distribution produces a tidy benchmark that describes no actual test. Split the same 1,206 findings by what was being tested and the picture changes completely.
Test type | Findings | Tests with findings | Median per test | High or Critical |
|---|---|---|---|---|
Web Application | 768 | 40 | 8 | 54% |
Internal Network | 408 | 8 | 11 | 92% |
External Network | 23 | 6 | 1 | 48% |
Mobile | 7 | 1 | not reported | not reported |
Total | 1,206 | 55 |
Source: Stingrai penetration testing platform data, October 2024 to August 2026.
Internal network testing produced a median of 11 findings per test and 92% of them were High or Critical, against 54% for web application and 48% for external network. Mobile appears in the table for completeness; its 7 findings from a single test are counted in corpus totals but not segmented.
The class mix diverges even more sharply than the severity mix.
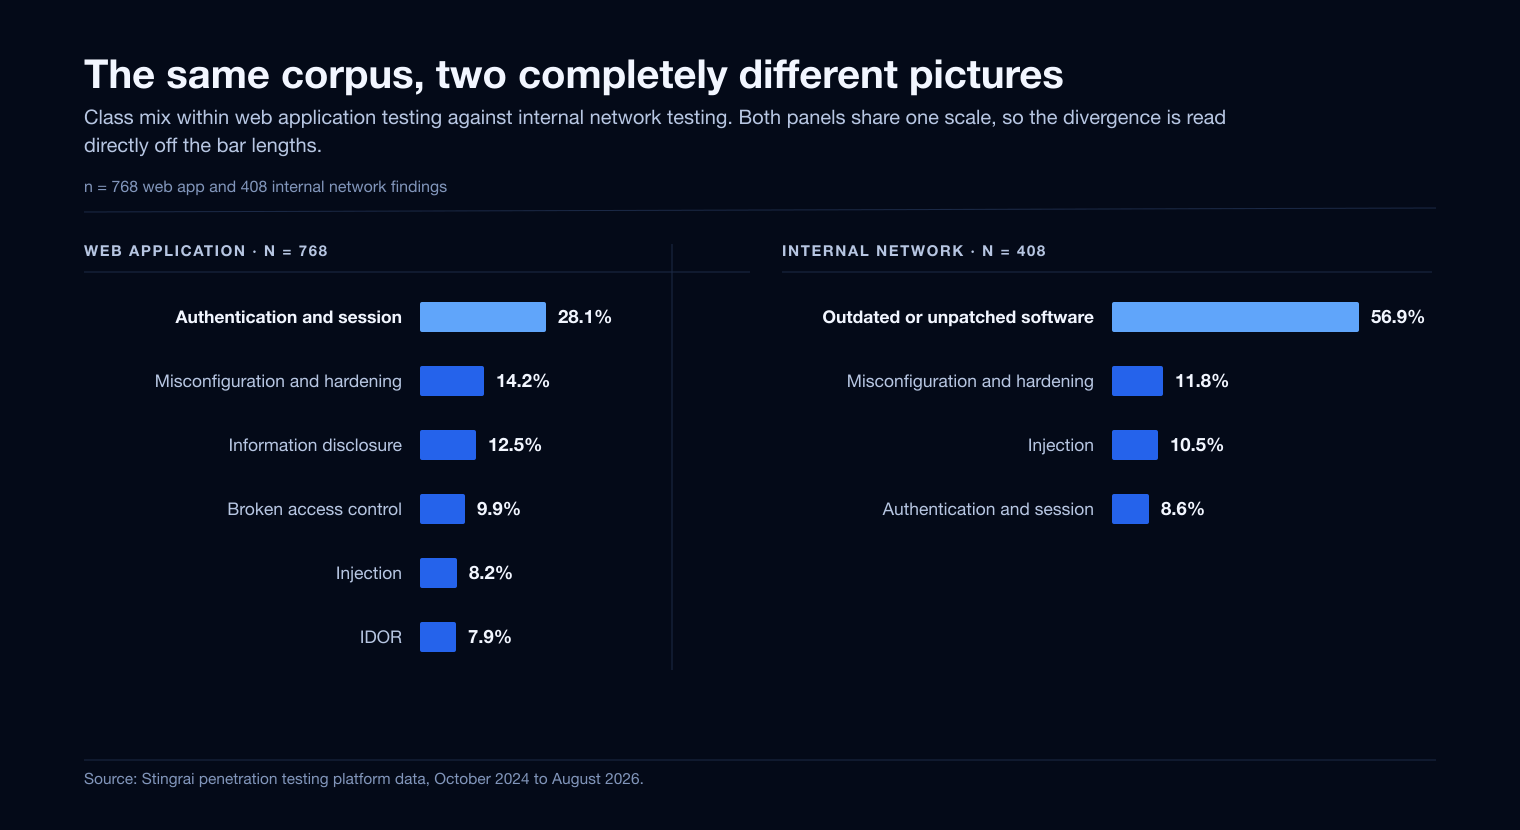
Web Application (n = 768) | Share | Internal Network (n = 408) | Share | |
|---|---|---|---|---|
Authentication and session | 28.1% | Outdated or unpatched software | 56.9% | |
Misconfiguration and hardening | 14.2% | Misconfiguration and hardening | 11.8% | |
Information disclosure | 12.5% | Injection | 10.5% | |
Broken access control | 9.9% | Authentication and session | 8.6% | |
Injection | 8.2% | |||
IDOR | 7.9% |
Source: Stingrai penetration testing platform data, October 2024 to August 2026.
Say the uncomfortable part plainly: the corpus-wide headline that outdated software is the largest severe category is substantially an internal network artifact. Outdated or unpatched software is 56.9% of internal network findings, more than five times the next class in that segment. In web application testing it does not appear in the top six at all, where authentication and session leads at 28.1% and broken access control plus IDOR together account for 17.8%.
Both facts are true, and they carry opposite instructions. If you are buying web application testing, the corpus-wide "patch your dependencies" conclusion is close to irrelevant, and what matters is that more than a quarter of what gets found is authentication and session handling. If you are buying internal network testing, patch and lifecycle management is not one factor among several, it is the overwhelming majority of what a tester will report, and 92% of it will land as High or Critical.
This is the strongest argument in this report against single-number benchmarking, including our own. Every pooled figure here is an average across four different kinds of work in unequal proportion, and the segmented view is the one to plan against.
The severe end
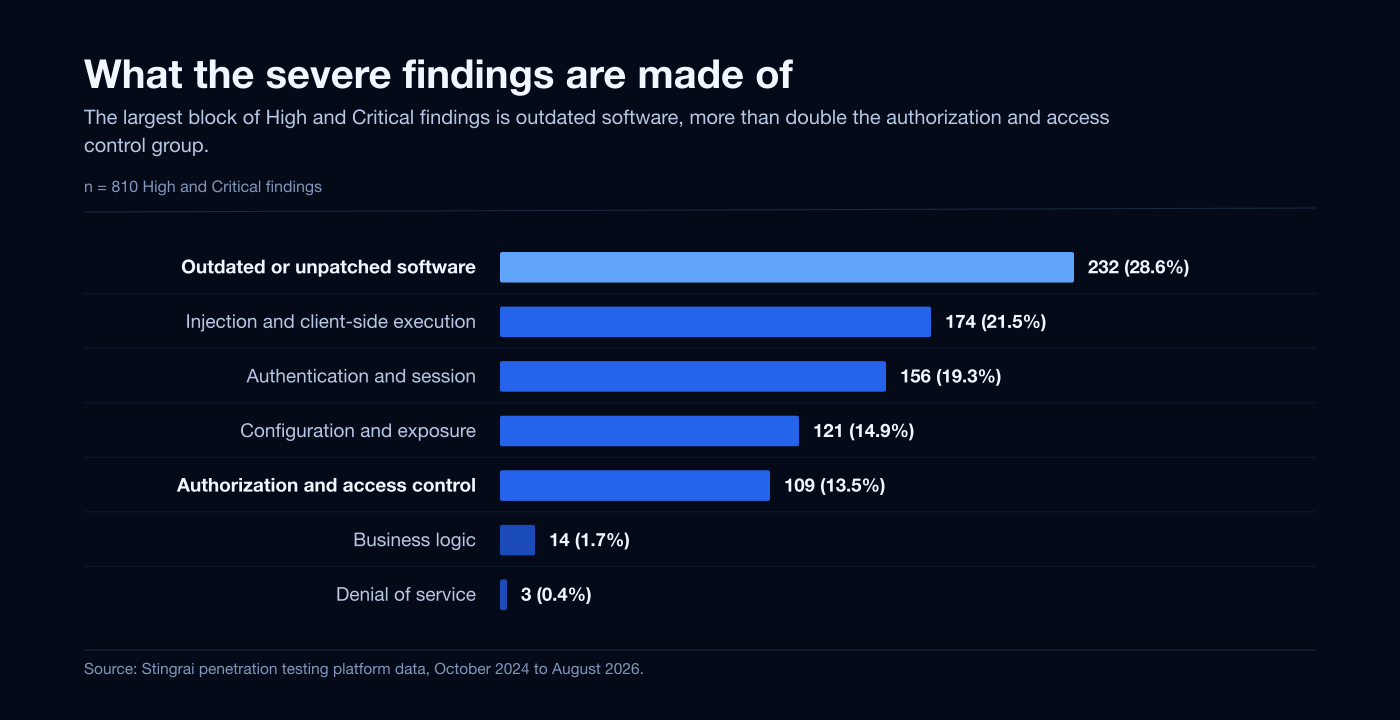
Group | High and Critical findings | Share of 810 |
|---|---|---|
Outdated or unpatched software | 232 | 28.6% |
Injection and client-side execution | 174 | 21.5% |
Authentication and session | 156 | 19.3% |
Configuration, exposure and disclosure | 121 | 14.9% |
Authorization and access control | 109 | 13.5% |
Business logic | 14 | 1.7% |
Denial of service | 3 | 0.4% |
Source: Stingrai penetration testing platform data, October 2024 to August 2026.
Outdated or unpatched software is 20.9% of all findings but 28.6% of the severe ones, the single largest block, ahead of injection and ahead of authentication. Read with the previous section, that is largely a statement about internal network estates rather than about application code.
It still deserves to be uncomfortable. Dependency and patch hygiene is the part of a security programme most organizations believe is handled: scanned, dashboarded, covered by an SLA, and the first thing an auditor asks about. It is also, here, the thing most likely to produce a severe finding when a penetration tester goes looking at an internal estate.
Breach telemetry points the same way from a different angle. Verizon's 2026 Data Breach Investigations Report found that "nearly a third (31%) of all breaches start with vulnerability exploitation", the first time in 19 years it has surpassed stolen credentials as the biggest point of entry (Verizon, 2026). The two measurements should not be added together: the DBIR measures the initial access vector of real breaches across a whole estate, while ours measures class composition inside a scoped test. They agree on direction, and that agreement is worth taking seriously.
What earns a Critical
The severity ladder is not one story. The class mix inside the 368 Critical findings is different from the mix inside the 442 High findings, and the difference is directional. High findings are led by outdated or unpatched software at 32.8%. Critical findings are led by authentication and session at 28.5%, with injection at 16.6% and authorization, broken access control plus IDOR, at 13.5% behind it. Patch debt earns a High; identity and injection earn a Critical.
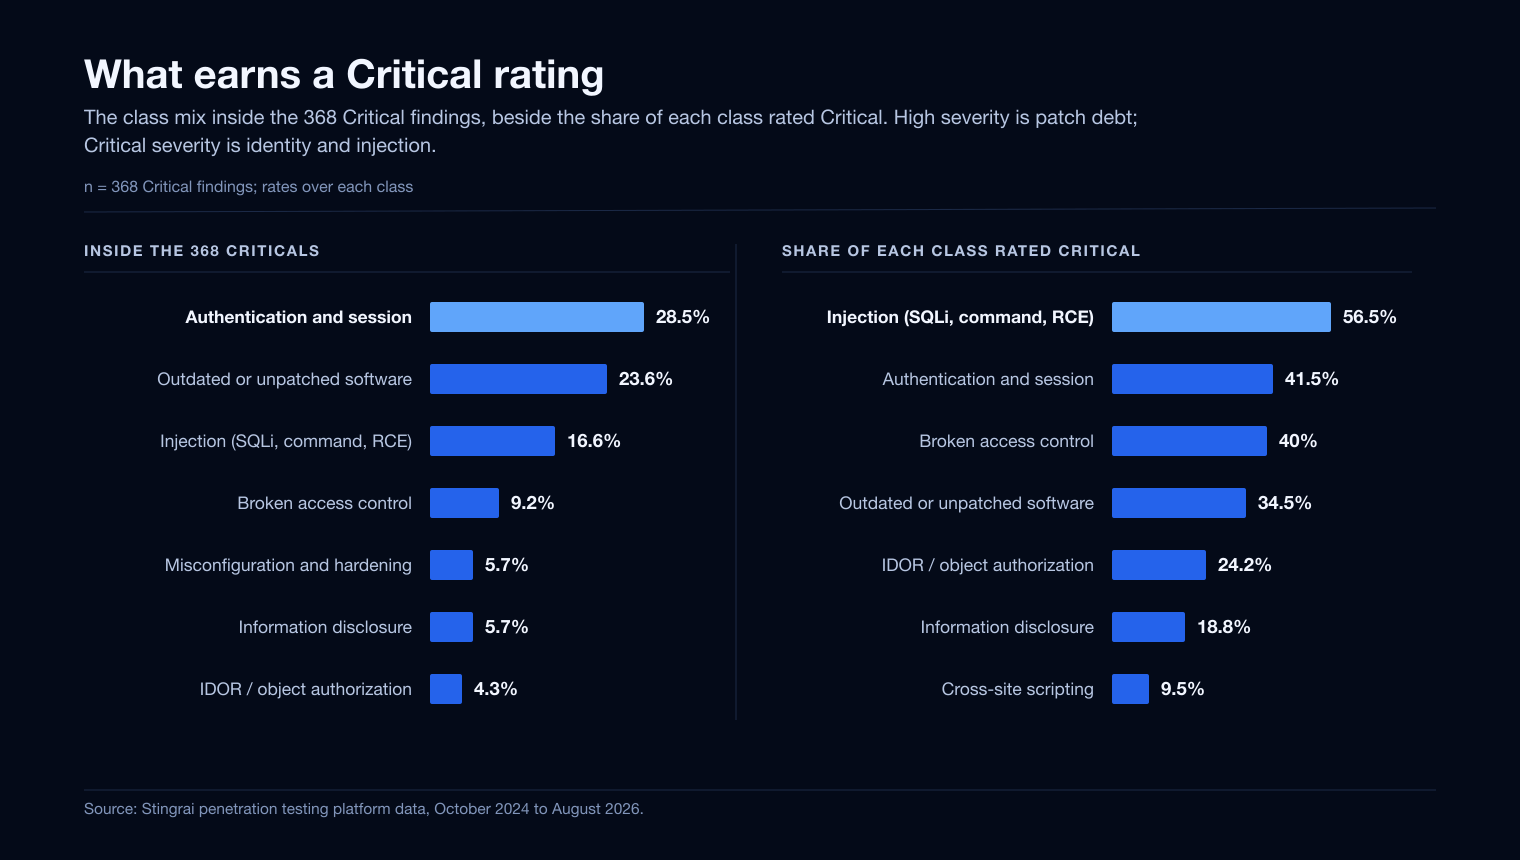
The conversion rates say the same thing. An injection finding was rated Critical 56.5% of the time, the highest of any class. Authentication and session converted at 41.5% and broken access control at 40.0%. Cross-site scripting sat at the other end: 81.0% of XSS findings landed High or Critical, but only 9.5% Critical, which is why XSS fills the High tier and almost never tops a report.
For buyers, the practical version is odds. Of the 40 web application tests that produced findings, 70% surfaced at least one High or Critical authentication or authorization finding, 48% surfaced a High or Critical injection, and 40% surfaced an injection rated Critical. Those are the classes that decide whether a report contains an emergency, and none of them can be found without understanding what the application is supposed to permit.
Scanner-shaped and context-dependent, in almost equal measure
Sort the classes by whether a tool could in principle recognise them without understanding the application, and the corpus splits nearly down the middle.
Scanner-shaped classes are the ones with a stable signature: outdated or unpatched software, security misconfiguration and hardening, exposed services and default access, and denial of service and rate limiting. Together, 449 findings, or 37.2% of the corpus.
Context-dependent classes are the ones where the vulnerability is defined by what the application is supposed to do: authentication and session, broken access control, IDOR and object-level authorization, and business logic. Together, 425 findings, or 35.2% of the corpus.
Two caveats before anyone quotes those numbers. The buckets are not a partition: the remaining 332 findings, 27.5% of the corpus, sit in neither, being injection and client-side execution and information disclosure. And "scanner-shaped" describes the class, not the finding: it means a signature could exist for that category, not that any particular tool would have found that instance in that deployment.
Within the severe findings the balance tilts:
Bucket | All findings (n = 1,206) | High and Critical (n = 810) |
|---|---|---|
Scanner-shaped classes | 449 (37.2%) | 317 (39.1%) |
Context-dependent classes | 425 (35.2%) | 279 (34.4%) |
Neither bucket | 332 (27.5%) | 214 (26.4%) |
Source: Stingrai penetration testing platform data, October 2024 to August 2026.
This is less flattering to the penetration testing industry than the usual version. The comfortable story is that scanners find noise and humans find the real problems. The data does not support it: scanner-shaped classes make up a slightly larger share of severe findings, 39.1%, than context-dependent ones at 34.4%.
Which means automation is not the junior partner. If nearly two fifths of your severe findings live in classes a tool can recognise, then not running that tool continuously is a choice to discover those issues once a year at pentest prices. It also means automation is not sufficient, and the missing third is the expensive third. There is no signature for "this user can read another tenant's invoice", because whether that is a bug depends entirely on what the product promised.
One observed difference, stated with its caveats
Within web application tests only, so the comparison is like-for-like, the 40 engagements split into 9 where Stingrai's autonomous agent Snipe was part of the engagement and 31 that were human-only.
Web application engagements | Tests | Findings | Median per test | High or Critical |
|---|---|---|---|---|
Snipe-enabled | 9 | 521 | 29 | 62% |
Human-only | 31 | 247 | 7 | 39% |
Source: Stingrai penetration testing platform data, October 2024 to August 2026.
That difference is observed, not explained, and three things prevent it from being read as a causal result. There are only 9 Snipe-enabled engagements. They are the most recent in the window, so application complexity and the maturity of our own methodology both differ from the earlier cohort. And scope selection differs between the two groups. A controlled comparison would need the same targets tested both ways, which this dataset does not contain.
How many findings does one penetration test produce?
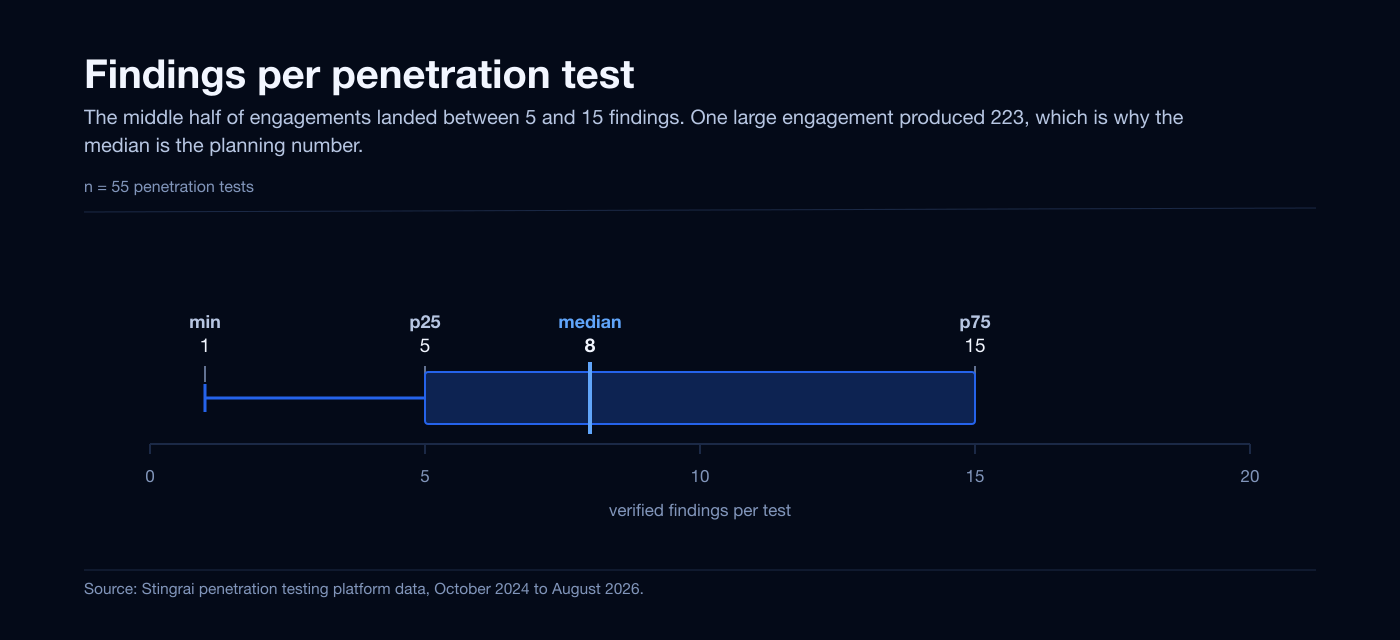
Across the 55 penetration tests, the median produced 8 verified findings, with a 25th percentile of 5, a 75th of 15, and a minimum of 1.
The maximum was 223, from one large engagement. That single result pulls the mean to 21.9, nearly three times the median, and is the clearest example in the dataset of why a mean alone misleads: quoting "an average of 22 findings per test" would describe almost none of the actual engagements. Five to fifteen findings is the realistic shape of the work to plan against, adjusted for test type using the segmentation above.
The false-positive number, and why it is 0.74%
Nine findings out of 1,216 logged were declined at review as false positives. That is 0.74%, and it is a property of process, not of tooling. A finding does not become a finding here because a tool emitted an alert. It becomes a finding when a penetration tester reproduces the issue and attaches evidence, and it reaches a client only after two stages of human review.
The relevance is comparative. The expensive failure mode in security tooling is not missing things, it is emitting things. Output that has not passed a verification gate transfers the whole triage cost onto the client's security team, who must work out one by one whether each candidate issue is real, without reproduction context. Requiring proof before a finding exists keeps that cost on the testing side. The figure should not be read against any published scanner accuracy rate; those measure a different object at a different stage of the pipeline.
What happens after the report
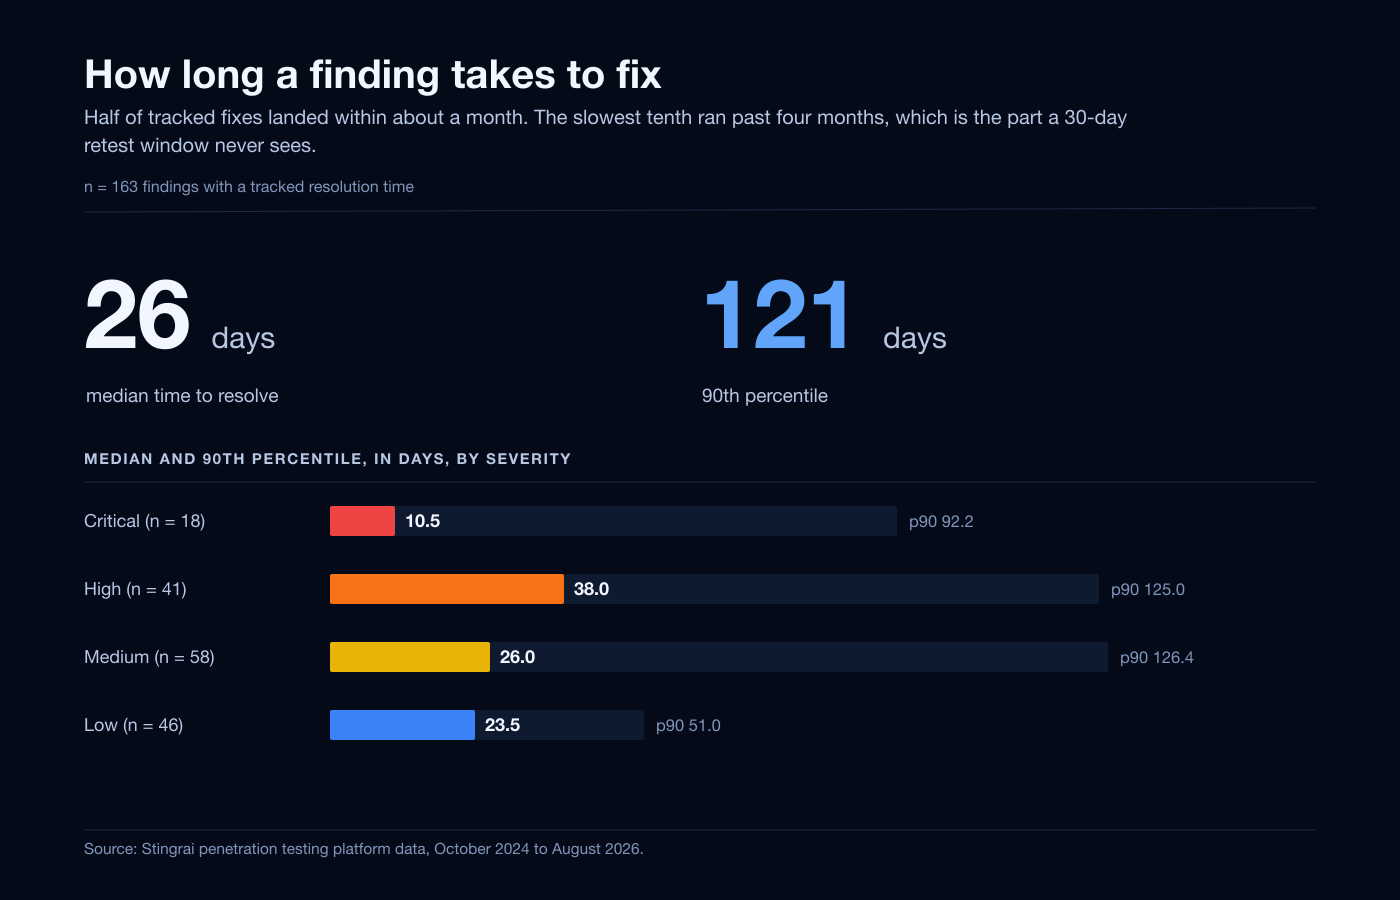
Where resolution time was tracked, across 163 findings, the median finding was resolved in 26.0 days and the 90th percentile in 121.2 days. Half of remediation is reasonably brisk; the slowest tenth stretches past four months. A 30-day retest window, a common contractual default, would confirm fixes for roughly half the findings and close before the tail has moved at all.
Breaking that down by severity produces the least expected result in the report.
Severity | Findings tracked | Median days | 90th percentile |
|---|---|---|---|
Critical | 18 | 10.5 | 92.2 |
High | 41 | 38.0 | 125.0 |
Medium | 58 | 26.0 | 126.4 |
Low | 46 | 23.5 | 51.0 |
Source: Stingrai penetration testing platform data, October 2024 to August 2026.
Critical findings were fixed fastest, at a median of 10.5 days. High findings took nearly four times as long at 38.0 days, slower than Medium and slower than Low. The usual assumption is that remediation speed tracks severity smoothly downward. It does not. Critical findings trigger something resembling incident response, with an owner and a deadline; High findings go into the backlog with everything else, and a Low that is a one-line config change gets closed faster than a High that needs an architectural decision.
The status counts are easy to misread. Across the logged findings, 1,014 sit at "Pending fix", 168 are Resolved, and 32 are Ready to retest. That does not mean most findings were never fixed. It means the platform observed closure for 168. Only 46 findings were synced to a client ticketing system such as GitHub Issues, Linear, or client ticketing systems, so for most it simply cannot see the client's remediation work. Retest was requested on 169 findings and retest evidence recorded on 64.
Remediation tracking is the weakest link in the chain, on both sides. Clients fix things in their own systems and rarely close the loop back, and testing platforms record intent more reliably than outcome. Anyone publishing "percentage of findings remediated" from platform status alone, ourselves included, would be publishing a number about their own instrumentation.
What this means for defenders
Benchmark against your test type, not against a pooled average. Internal network testing here returned a median of 11 findings at 92% High or Critical; web application testing returned 8 at 54%. Planning either one off a blended figure gets the volume and the severity mix wrong.
Split the budget the way the findings split. For internal network scope, outdated software is 56.9% of what comes back, so patch and lifecycle management is the programme, not a workstream inside it. For web application scope, authentication, access control and IDOR are where the findings concentrate, and none of them can be found without knowing what the application is supposed to permit.
Run the scanner-shaped classes continuously, not annually. They were 37.2% of findings and 39.1% of severe ones, and they have signatures, so they can be checked on every deploy. Discovering them at pentest cadence is paying human rates for work that does not need human judgement.
Watch the High queue, not just the Critical queue. Critical findings closed at a median of 10.5 days here while High findings took 38.0. If your SLA treats High as "urgent but not an incident", that is where the exposure accumulates.
Size the retest window against the p90, not the median. Half of fixes land inside 26 days and the slowest tenth run past 121, so including retesting in the engagement is the cheapest way to make the tail visible.
Close the remediation loop in one system. Only 46 findings here were synced to a client tracker, and a finding that lives in two places without a link is one whose outcome nobody can report on later.
Stingrai's web application penetration testing and internal and external network testing engagements are delivered as one-time assessments and as continuous programmes through Stingrai's PTaaS platform, the system this data comes from. On splitting scope between automated and human effort, we covered that tradeoff in autonomous versus human penetration testing.
Frequently asked questions
What percentage of penetration tests find a critical vulnerability in 2026?
In Stingrai's data covering 55 penetration tests between October 2024 and August 2026, 38 of 55 (69.1%) included at least one Critical finding, and 51 of 55 (92.7%) included at least one High or Critical.
What is the most common type of penetration test finding?
Across the whole corpus, authentication and session issues, at 253 of 1,206 verified findings or 21.0%, narrowly ahead of outdated or unpatched software at 20.9%. That pooled answer is misleading on its own: in web application testing authentication and session is 28.1% of findings, while in internal network testing outdated or unpatched software is 56.9%.
What does a web application penetration test typically find?
In this dataset, 768 findings across 40 web application tests, a median of 8 per test, and 54% High or Critical. The class mix is led by authentication and session at 28.1%, then misconfiguration and hardening at 14.2%, information disclosure at 12.5%, broken access control at 9.9%, injection at 8.2%, and IDOR at 7.9%.
How is an internal network penetration test different?
It returns more findings and far more severe ones: 408 findings across 8 engagements, a median of 11 per test, and 92% High or Critical against 54% for web application testing. The class mix is dominated by outdated or unpatched software at 56.9%, more than five times the next category.
What kind of vulnerability causes the most severe findings?
Outdated or unpatched software, at 232 of the 810 High and Critical findings, or 28.6%. Injection and client-side execution follows at 21.5%, authentication and session at 19.3%, configuration and exposure at 14.9%, and authorization and access control at 13.5%. That ranking is substantially driven by internal network testing.
Which vulnerability classes produce Critical findings?
Authentication and session is the largest class inside Critical findings at 28.5%, followed by outdated software at 23.6% and injection at 16.6%. Injection converts to Critical most often: 56.5% of injection findings were rated Critical, against 41.5% for authentication and session and 9.5% for cross-site scripting.
Can an automated scanner replace a penetration test?
Not on this evidence, and not the reverse either. Classes a scanner could in principle flag account for 37.2% of findings and 39.1% of severe ones, while classes requiring an understanding of the application account for 35.2% and 34.4%. Roughly one severe finding in three depends on what the product is supposed to permit, which no signature encodes.
How many findings does a typical penetration test produce?
The median test produced 8 verified findings, with an interquartile range of 5 to 15. The mean is 21.9, distorted by one large engagement that produced 223 findings, so the median is the better planning number, adjusted for test type.
What is a good false-positive rate for a penetration test?
In this dataset, 9 of 1,216 logged findings were declined at review, a rate of 0.74%, achievable because every finding requires reproduction evidence and passes two stages of human review before delivery. Rates published for unvalidated tool output measure a different stage of the pipeline.
How long does it take to fix a penetration test finding?
Across the 163 findings with a tracked resolution time, the median was 26.0 days and the 90th percentile 121.2 days. By severity, Critical findings closed fastest at a median of 10.5 days while High findings took 38.0.
Does "pending fix" mean the vulnerability was never remediated?
No, and this is the most common misreading of platform status data. 1,014 findings show "Pending fix", but only 46 were synced to a client ticketing system, so the platform cannot observe remediation done in a client's own tracker. Closure was observed for 168 findings; the remainder is unknown, not unfixed.
How were the vulnerability classes in this report assigned?
By rule-based analysis of every finding title, applied uniformly across the corpus. The method reads titles only, not full descriptions, which makes it conservative.
About this data
Stingrai is a Toronto-based offensive security firm founded in 2021, delivering penetration testing as one-time assessments and as continuous programmes. Engagements are joint: certified penetration testers and Snipe, Stingrai's autonomous web application testing agent, work the same target concurrently, with the testers directing where the agent focuses and pursuing what it surfaces. Findings from both paths go through the identical evidence requirement and two-stage review described in the methodology, which is what makes them comparable in a single dataset.
We publish this because the penetration testing industry quotes a great many statistics and publishes very little of its own operational data, and almost none of it segmented by what was actually tested. This edition also corrects an earlier internal analysis of the same corpus that relied on a platform field which did not mean what it appeared to mean.
Cite this report: Stingrai, The State of Penetration Testing 2026: What 1,206 Verified Findings Show, August 2026. https://www.stingrai.io/blog/state-of-penetration-testing-2026
References
Stingrai. Penetration testing platform data, October 2024 to August 2026 extract. https://www.stingrai.io/blog/state-of-penetration-testing-2026. Covers 55 penetration tests and 1,216 logged findings, of which 1,206 form the verified analysis set, segmented by test type. Primary source for every first-party figure here.
Verizon Business. 2026 Data Breach Investigations Report. Published 19 May 2026. https://www.verizon.com/about/news/breach-industry-wide-dbir-finds. Annual analysis of real-world security incidents and confirmed breaches. Cited for the finding that 31% of breaches begin with vulnerability exploitation, the first time in 19 years it has surpassed stolen credentials as the leading point of entry. Report landing page: https://www.verizon.com/business/resources/reports/dbir/.