




Identity compromise opened 83% of the cloud and SaaS intrusions that Mandiant's incident response and threat defense teams handled in the second half of 2025, according to Google Cloud's Cloud Threat Horizons Report H1 2026. The CrowdStrike 2026 Global Threat Report found valid account abuse behind 35% of cloud incidents in 2025, and Sysdig's 2026 Cloud-Native Security and Usage Report counts human users as just 2.8% of the managed identities inside cloud environments. In those intrusions attackers signed in far more often than they broke in, and the identities available to them are overwhelmingly machine accounts, many of them overprivileged or long forgotten.
Four forces shape cloud security in 2026. Cost: the average breach involving data stored in the public cloud cost US$5.38 million in the IBM Cost of a Data Breach Report 2026, against a global average of US$4.99 million. Exploitation: software exploitation became the most common way into Google Cloud workloads at 44.5% of initial access in the second half of 2025, overtaking weak or absent credentials for the first time, and CrowdStrike's 2026 Threat Hunting Report found 88% of the proof-of-concept exploitation it observed across all environments from January to June 2026 happened within 48 hours of the exploit's release. Speed: across all the environments CrowdStrike tracks, not only cloud, the average eCrime breakout time fell to 29 minutes in 2025, and the fastest took 27 seconds. AI workloads: cloud misconfigurations affecting AI workloads caused 27% of AI-related breaches in IBM's 2026 study. The tables below are built for CISOs, cloud platform owners, auditors and journalists in the United States and Canada who need a cloud security number with a source they can cite.
This post is the Stingrai research team's canonical 2026 reference for cloud security statistics. It assembles more than 150 figures from 16 primary publishers: Google Cloud and its Mandiant unit, IBM, Verizon, CrowdStrike, Microsoft, Datadog, Sysdig, Tenable, Intruder, Red Hat, the Cloud Security Alliance, the Cloud Native Computing Foundation, GitGuardian, the Cybersecurity and Infrastructure Security Agency, the Canadian Centre for Cyber Security and Amazon Web Services. Lead data is calendar 2025 telemetry, the freshest available, with first-half 2026 figures where publishers have released them; primary publishers have not yet released full-year 2026 reports as of October 2026. Every stat carries its source, year, and methodology window so any claim can be audited inline.
Key cloud security statistics at a glance (2026)
Cloud and SaaS intrusions that began with identity compromise (H2 2025): 83% of Mandiant incident response and threat defense cases (Google Cloud, Cloud Threat Horizons Report H1 2026).
Average cost of a breach involving data stored in the public cloud (2026 report): US$5.38 million, up from US$4.68 million in the 2025 edition (IBM Cost of a Data Breach Report 2026).
Initial access into Google Cloud workloads through software exploitation (H2 2025): 44.5%, ahead of weak or absent credentials at 27.2% (Google Cloud, Cloud Threat Horizons Report H1 2026).
Growth in cloud-conscious eCrime activity (July 2025 to June 2026 report window): 171% (CrowdStrike 2026 Threat Hunting Report).
Average eCrime breakout time, all environments (2025): 29 minutes, with the fastest at 27 seconds (CrowdStrike 2026 Global Threat Report).
Cloud incidents involving valid account abuse (2025): 35% (CrowdStrike 2026 Global Threat Report).
Cloud accounts with weak IAM controls (12 months to July 2026): 97% on AWS, 90% on Azure and 87% on Google Cloud (Intruder 2026 Cloud Security Index).
Organizations with an IaaS admin account that had MFA disabled (2026 report snapshot): 37% (Verizon 2026 Data Breach Investigations Report).
AWS IAM users with an active access key older than one year (September 2025): 59% (Datadog State of Cloud Security 2025).
AI-related breaches caused by cloud misconfigurations affecting AI workloads (2026 report): 27%, at an average cost of US$5.25 million (IBM Cost of a Data Breach Report 2026).
Managed Kubernetes clusters with an internet-exposed API server (September 2025): 54% of GKE, 39% of EKS and 34% of AKS clusters (Datadog State of Cloud Security 2025).
Organizations with at least one cloud-native security incident in the past year (Red Hat survey of 600 IT professionals, August to September 2025): 97% (Red Hat, The state of cloud-native security report, 2026 edition).
Key takeaways
Identity, not cloud infrastructure, is where most cloud breaches start. Mandiant traced 83% of its second-half 2025 cloud and SaaS cases to identity: stolen credentials (21%), compromised third parties (21%), voice phishing (17%), email phishing (12%), malicious insiders (7%), software supply chain compromise (3%) and other phishing (2%). Google says the software exploitation it saw in the same period did not involve breaches of Google Cloud's core infrastructure, and the experts surveyed by the Cloud Security Alliance rated underlying infrastructure and provider concerns low enough to drop them from the 2026 top threats list, which inadequate identity and access management now leads.
Software exploitation is the fastest-rising way into cloud workloads. Software-based entry reached 44.5% of initial access into Google Cloud workloads in the second half of 2025, with remote code execution up from 2.9% to 13.6%, and attackers deployed cryptocurrency miners within about 48 hours of the React2Shell disclosure. Across all environments, CrowdStrike found 88% of the proof-of-concept exploitation it observed in the first half of 2026 happened within 48 hours of release, and Mandiant estimates the mean time to exploit at minus seven days, meaning exploitation before a patch exists.
Cloud breaches cost more than on-premises breaches. IBM's 2026 report puts breaches of public cloud data at US$5.38 million and breaches spanning on-premises, private and public cloud at US$5.39 million, against US$4.56 million for data held on premises. Breaches spanning all three locations took the longest to identify and contain, at 256 days.
Machine identities are the unmanaged majority. Machines hold 97.2% of managed cloud identities in Sysdig's data, 52% of non-human identities carry critical excessive permissions in Tenable's, and 59% of AWS IAM users still hold an active access key older than a year in Datadog's. Tenable also found 65% of organizations holding unused or unrotated "ghost" cloud credentials.
AI workloads are inheriting old cloud mistakes. Cloud misconfigurations affecting AI workloads caused 27% of AI-related breaches in IBM's study, and 92% of organizations with an AI-related breach lacked proper AI access controls. In a November 2025 intrusion analyzed by Sysdig, credentials exposed in public S3 buckets that held retrieval-augmented generation data for AI models led to AWS administrator access in under 10 minutes, then to abuse of Amazon Bedrock and GPU compute.
Secure defaults outperform manual hardening. Only 49% of EC2 instances enforce IMDSv2, yet enforcement passes 95% where an organization turns on the regional default, and just 1% of S3 buckets are effectively public. Exposed services affected 8% of Google Cloud accounts in Intruder's index against 76% of AWS accounts, a gap Intruder links partly to Google Cloud's shared fate approach and its more secure defaults.
Methodology and limitations
Date cutoff: 1 October 2026. Every figure was read from the publisher's own page or report during a research pass on that date. The sources, their publication dates and their data windows are:
Google Cloud: Cloud Threat Horizons Report H1 2026 (published March 2026 and announced by Google Cloud's Office of the CISO on 10 March 2026; incidents from the second half of 2025). It holds two datasets: incidents in Google Cloud customer workloads, which Google notes reflect a subset of observed activity and may not represent all customers, and Mandiant Incident Response and Mandiant Threat Defense engagements across major cloud and SaaS environments.
Mandiant (Google Cloud): M-Trends 2026 (23 March 2026; investigations from 1 January to 31 December 2025, more than 500,000 hours of incident response) and the UNC5537 Snowflake campaign analysis (10 June 2024), used as a dated case study.
IBM: Cost of a Data Breach Report 2026 (29 July 2026; 602 breached organizations, breaches between March 2025 and February 2026, 3,558 interviews, research by Ponemon Institute).
Verizon: 2026 Data Breach Investigations Report (19 May 2026; incidents from 1 November 2024 to 31 October 2025, including third-party cloud exposure data from a new research partner).
CrowdStrike: 2026 Global Threat Report (24 February 2026; calendar 2025) and 2026 Threat Hunting Report (3 August 2026; investigations from 1 July 2025 to 30 June 2026).
Microsoft: Microsoft Digital Defense Report 2025 (16 October 2025; July 2024 to June 2025).
Datadog: State of Cloud Security, 2025 edition (October 2025; posture data from a sample of thousands of customer organizations, collected in September 2025).
Sysdig: 2026 Cloud-Native Security and Usage Report (16 April 2026; customer telemetry spanning billions of software packages and hundreds of thousands of cloud identities) and its Threat Research Team's incident analysis (3 February 2026; intrusion observed on 28 November 2025).
Tenable: Cloud and AI Security Risk Report 2026 (19 February 2026; telemetry from April to October 2025, with AI findings through December 2025).
Intruder: 2026 Cloud Security Index (11 August 2026; misconfiguration data from 3,000 organizations over the 12 months to July 2026).
Red Hat: The state of cloud-native security report, 2026 edition (22 December 2025; 600 respondents at companies with 100 or more employees, surveyed online from 25 August to 23 September 2025).
Cloud Security Alliance: Top Threats to Cloud Computing Survey Report 2026 (released 12 August 2026; more than 500 industry experts rating a short-list of 23 issues).
Cloud Native Computing Foundation: 2025 Annual Cloud Native Survey (results released 20 January 2026; web survey of 628 respondents run by Linux Foundation Research in September 2025).
GitGuardian: The State of Secrets Sprawl 2026 (17 March 2026; public GitHub commits in 2025, validity retested in January 2026).
Government and provider guidance: CISA Binding Operational Directive 25-01 (17 December 2024), the CISA and NSA cloud security information sheets (7 March 2024), the Canadian Centre for Cyber Security's Cloud security risk management guidance, ITSM.50.062 (March 2019), and the AWS, Microsoft and Google Cloud shared responsibility documentation (accessed 1 October 2026).
Limitations a reader should keep in mind:
Vendor telemetry is not a population sample. Datadog, Sysdig, Tenable and Intruder measure their own customers' environments, which skew toward organizations that already buy cloud security tooling. Google Cloud's workload data covers incidents Google observed on its own platform, and Mandiant and CrowdStrike figures describe organizations that engaged them or run their sensors. Treat these numbers as strong signals about patterns, not as prevalence rates for every organization.
Surveys measure what respondents report. Red Hat, CNCF and Cloud Security Alliance figures are survey results, and the Cloud Security Alliance ranking reflects expert opinion rather than incident counts.
Definitions differ. "Cloud-conscious" is CrowdStrike's term, "identity issues" is Google Cloud's grouping, misconfiguration means different things to Google Cloud, Intruder and Red Hat, and IBM's storage categories describe where breached data was stored, as reported by the breached organizations.
Windows differ. Most lead figures cover calendar 2025, CrowdStrike's threat hunting data runs from July 2025 to June 2026, Intruder's index runs to July 2026, and IBM's study covers breaches from March 2025 to February 2026. Figures from different windows are shown side by side, never added together.
Currency and calculations. All dollar figures are US dollars as published, and none was converted. Any figure marked as a Stingrai calculation is arithmetic on the source figures beside it.
Dropped figures. A cloud-specific breakdown of initial infection vectors that circulated in coverage of M-Trends 2026 was left out because it could not be confirmed in a publicly accessible Mandiant document, and a vendor survey that did not publish its sample size or time frame was excluded. Stats that could not be reached on at least one verification pass against a named primary source were dropped rather than estimated.
How do attackers get into cloud environments?
The answer depends on which cloud data you read, and Google Cloud's Cloud Threat Horizons Report H1 2026 holds both views. Inside Google Cloud customer workloads, attackers most often exploited software the customer ran. Across the wider set of cloud and SaaS intrusions Mandiant responders handled, attackers most often came in through an identity.
Table 1: Initial access into Google Cloud workloads, H2 2025
Initial access vector | H2 2025 | H1 2025 | Source |
|---|---|---|---|
Vulnerable software (excluding remote code execution) | 30.9% | Not compared | Google Cloud Threat Horizons H1 2026 |
Weak or absent credentials | 27.2% | 47.1% | Google Cloud Threat Horizons H1 2026 |
Misconfiguration | 21.0% | 29.4% | Google Cloud Threat Horizons H1 2026 |
Remote code execution | 13.6% | 2.9% | Google Cloud Threat Horizons H1 2026 |
Exposed sensitive UI or API | 4.9% | 11.8% | Google Cloud Threat Horizons H1 2026 |
Other | 2.5% | Not compared | Google Cloud Threat Horizons H1 2026 |
H1 2025 values are the comparisons Google makes in the H1 2026 report. Vulnerable software and remote code execution together make up the 44.5% Google calls software-based entry, which overtook weak credentials as the primary initial access vector for the first time. The exploited software was third-party software that customers ran themselves: Google says these incidents targeted external vulnerabilities, such as the React2Shell flaw in React Server Components (CVE-2025-55182), and did not involve breaches of Google Cloud's core infrastructure. Attackers deployed cryptocurrency miners within about 48 hours of React2Shell's public disclosure.
Table 2: Initial access in cloud and SaaS intrusions handled by Mandiant, H2 2025
Initial access vector | Share of cases | Identity-related |
|---|---|---|
Stolen credentials (human and non-human identities) | 21% | Yes |
Compromised third-party relationships | 21% | Yes |
Voice phishing (vishing) | 17% | Yes |
Email phishing | 12% | Yes |
Malicious insiders, including North Korean IT workers | 7% | Yes |
Misconfiguration | 7% | No |
Software supply chain compromise | 3% | Yes |
Other phishing | 2% | Yes |
Vulnerability exploitation | 2% | No |
Other | 8% | No |
Source: Google Cloud, Cloud Threat Horizons Report H1 2026, based on Mandiant Incident Response and Mandiant Threat Defense engagements in major cloud and SaaS environments. The identity-related vectors total 83%.
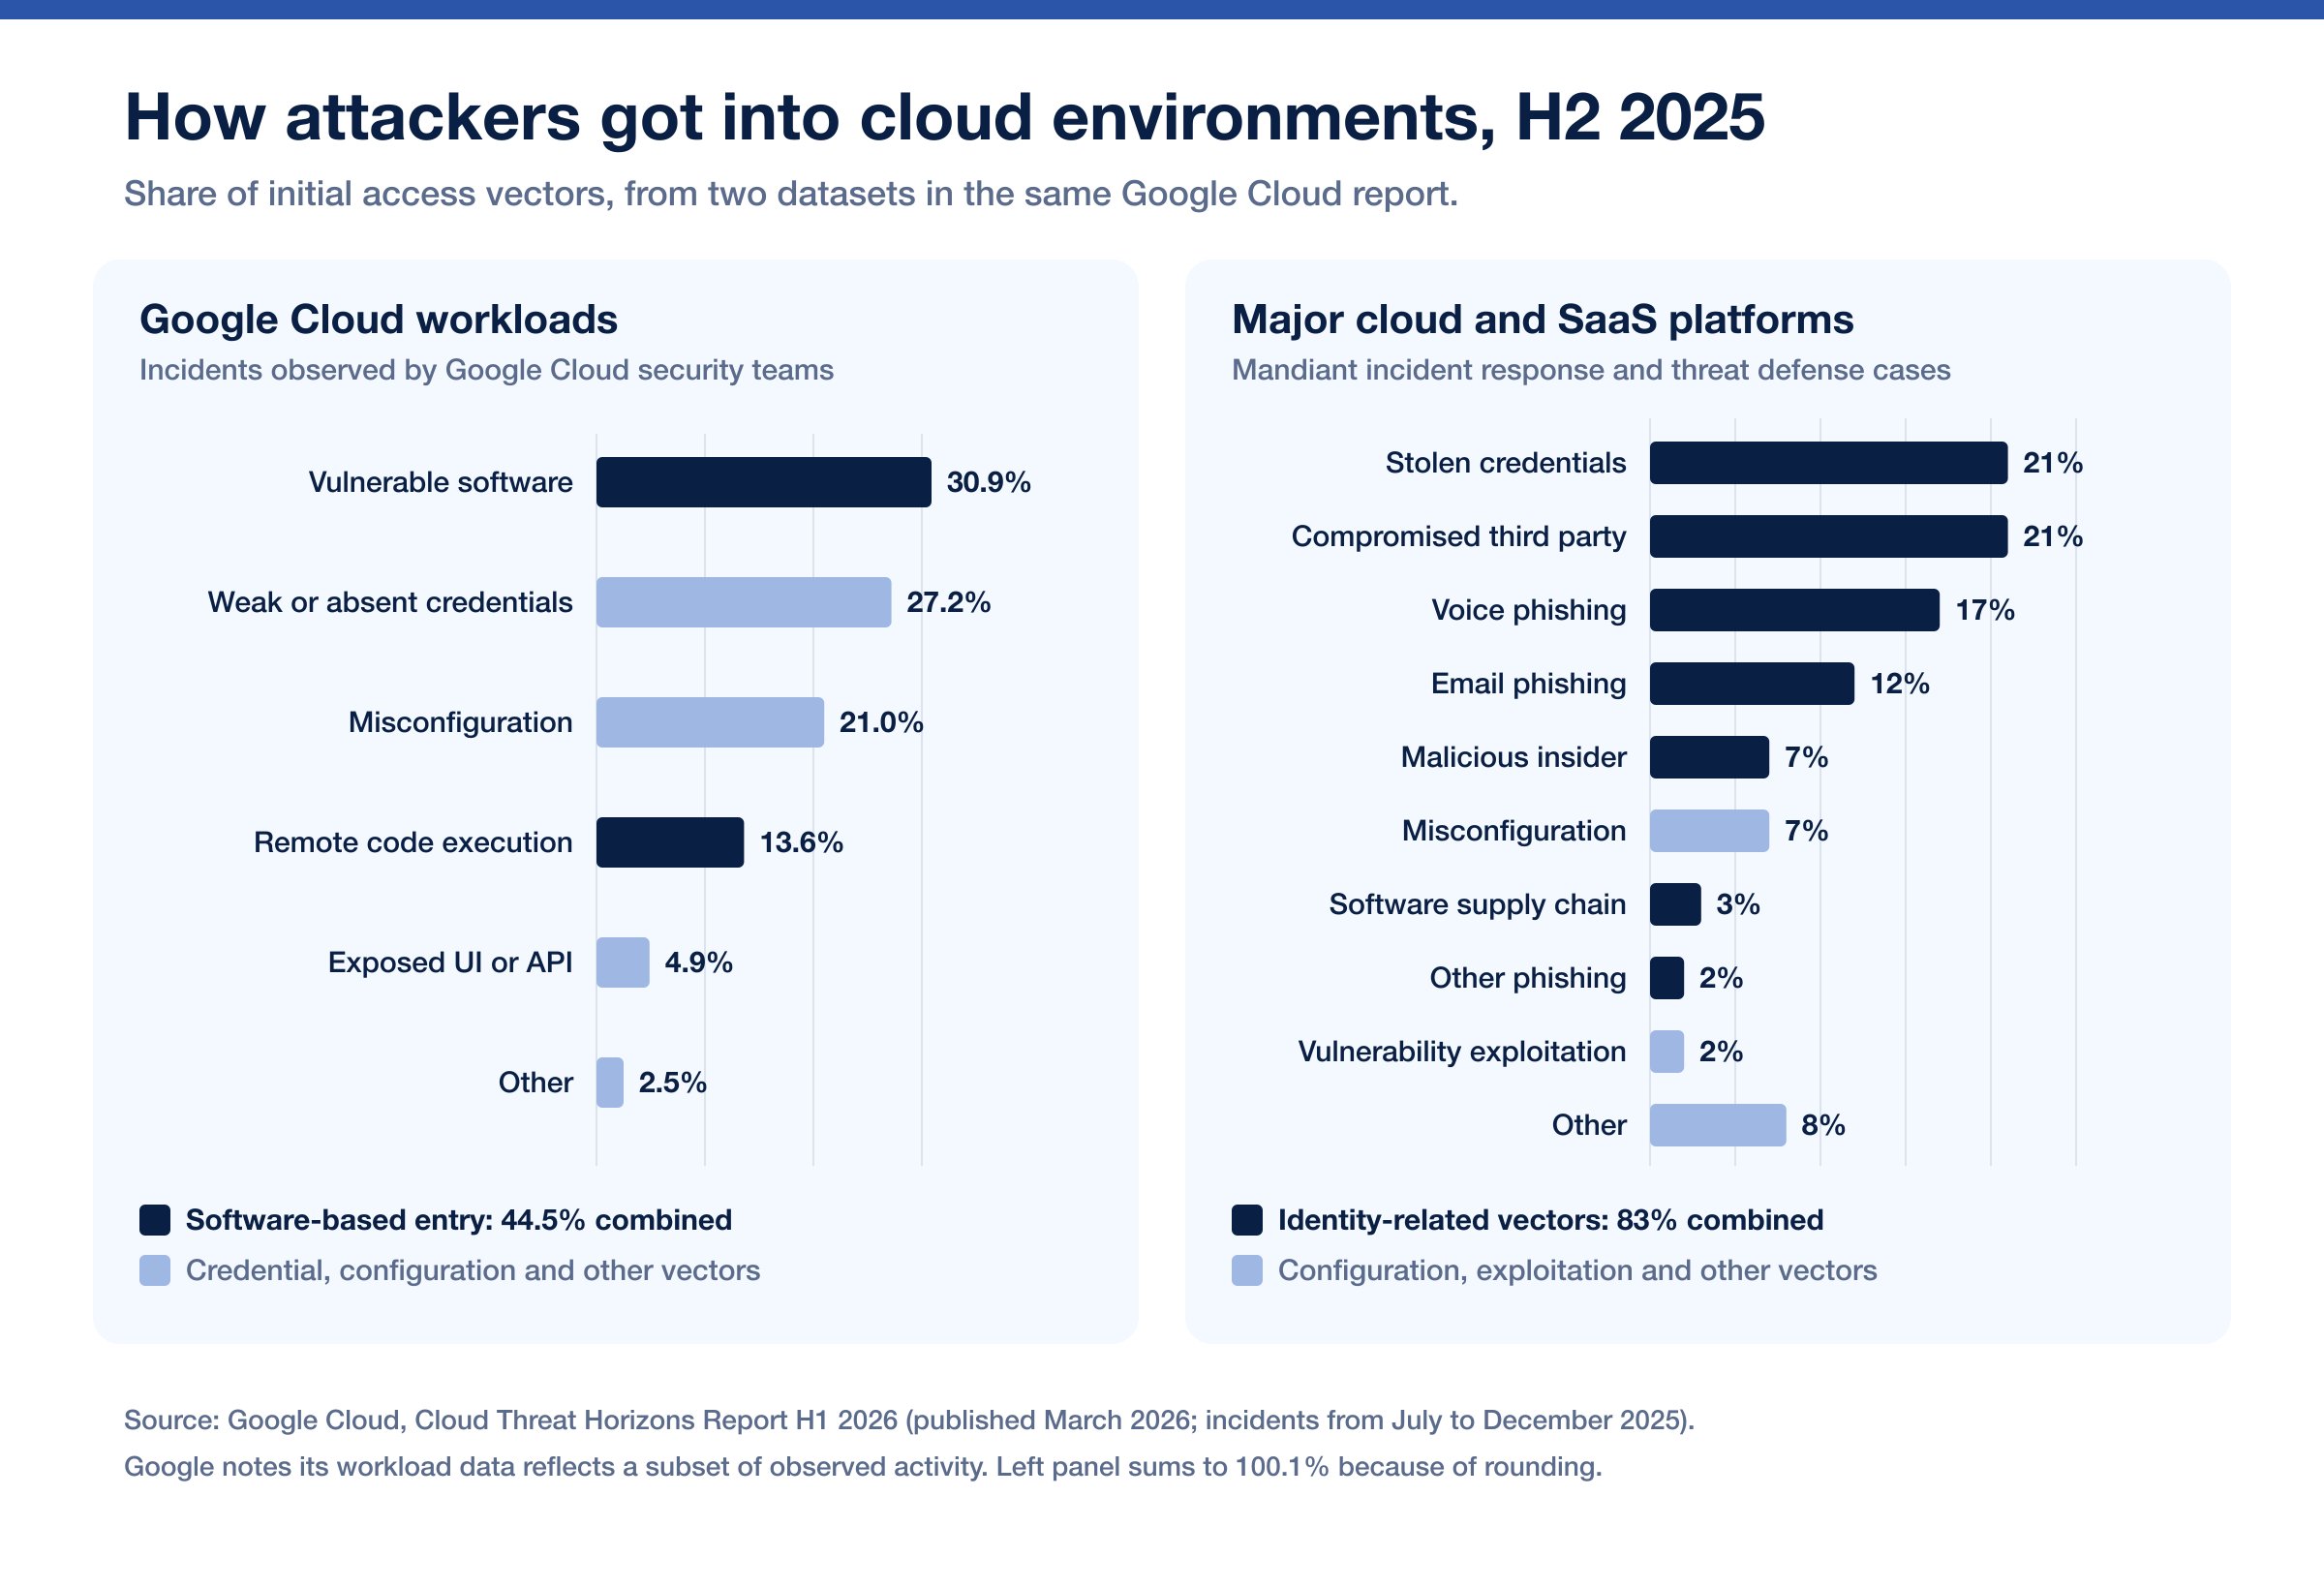
Figure 1: How attackers got into cloud environments in the second half of 2025, two datasets from the same report. Source: Google Cloud, [Cloud Threat Horizons Report H1 2026](https://cloud.google.com/security/report/resources/cloud-threat-horizons-report-h1-2026), published March 2026.
The attackers in these cases wanted data. Google's metrics show data was the target in 73% of cloud-related incidents: 45% ended in data theft without an immediate extortion demand and 28% in theft with signs of extortion. Two techniques stand out in Google's case notes. Groups such as UNC3944 impersonated employees to talk IT help desks into resetting credentials and multi-factor authentication, and UNC6040 used similar calls to get staff to authorize legitimate tools such as Salesforce Data Loader for bulk data export. UNC6395 needed no password at all: it used compromised OAuth tokens from the Salesloft Drift application to pull data in bulk from Salesforce tenants.
Other datasets point the same way.
Table 3: Identity attack statistics, 2025 to 2026
Metric | Figure | Period | Source |
|---|---|---|---|
Cloud incidents involving valid account abuse | 35% | 2025 | |
Growth in cloud-conscious intrusions | 37% overall, 266% among state-nexus actors | 2025 | |
Detections that were malware-free | 82% | 2025 | CrowdStrike 2026 Global Threat Report |
Growth in cloud-conscious eCrime activity | 171% | July 2025 to June 2026 report window | |
Vishing intrusions | Doubled | First half of 2026 vs second half of 2025 | CrowdStrike 2026 Threat Hunting Report |
Monthly device code phishing attempts | Up 15x | First half of 2026 | CrowdStrike 2026 Threat Hunting Report |
Identity attacks that are password attacks | More than 97% | July 2024 to June 2025 | |
Growth in identity-based attacks | 32% | First half of 2025 | Microsoft Digital Defense Report 2025 |
Identity attacks phishing-resistant MFA can stop | More than 99% | July 2024 to June 2025 | Microsoft Digital Defense Report 2025 |
Organizations with an IaaS admin account that had MFA disabled | 37% (14% on Snowflake) | 2026 report snapshot | |
Breaches that began with credential abuse, all environments | 13% (vulnerability exploitation: 31%) | November 2024 to October 2025 | Verizon 2026 Data Breach Investigations Report |
Intrusions that began with voice phishing, all environments | 11% (exploits: 32%; email phishing: 6%) | 2025 |
The shift from email to voice is the clearest trend. In Mandiant's all-environment data, email phishing fell from 14% of intrusions in 2024 to 6% in 2025 while voice phishing rose to 11%, and in its cloud and SaaS cases vishing (17%) already outweighs email phishing (12%). CrowdStrike adds that 82% of its 2025 detections were malware-free, because attackers moved with valid credentials, trusted identity flows and approved SaaS integrations.
Cloud identity statistics: the accounts attackers sign in with
The identity estate attackers target is mostly machines, and much of it is stale. Datadog notes that earlier editions of its research found long-lived cloud credentials to be the most common cause of publicly documented cloud security breaches.
Table 4: Cloud identity hygiene, 2025 to 2026
Metric | Figure | Source |
|---|---|---|
Managed cloud identities that belong to machines | 97.2% (human users: 2.8%) | |
Machine identities with some level of risk, such as admin or edit rights, user-managed keys or inactivity | About 40% | Sysdig, 2026 report data |
User identities considered risky, on average across providers | 67% | Sysdig, 2026 report data |
Organizations with identities in more than one cloud provider | 24% | Sysdig, 2026 report data |
Non-human identities with critical excessive permissions | 52% (human identities: 37%) | |
Identities with critical excessive permissions that are dormant | 49% | Tenable Cloud and AI Security Risk Report 2026 |
Organizations holding unused or unrotated "ghost" cloud credentials | 65% (17% of them tied to critical admin privileges) | Tenable Cloud and AI Security Risk Report 2026 |
AWS IAM users with an active access key older than one year | 59% (over half of those unused for 90+ days) | |
Google Cloud service accounts with keys older than one year | 55% (62% a year earlier) | Datadog State of Cloud Security 2025 |
Microsoft Entra ID applications with credentials older than one year | 40% (46% a year earlier) | Datadog State of Cloud Security 2025 |
Organizations still using AWS IAM users | 39% (one in five rely on them exclusively) | Datadog State of Cloud Security 2025 |
Azure accounts with Entra users who lack MFA | 55% | |
Google Cloud accounts without OS Login MFA | 77% | Intruder 2026 Cloud Security Index |
AWS accounts with an IAM access key that has not been rotated | 71% | Intruder 2026 Cloud Security Index |
New hardcoded secrets found in public GitHub commits | 28.65 million in 2025, up 34% | |
Secrets confirmed valid in 2022 that were still valid in January 2026 | More than 64% | GitGuardian, The State of Secrets Sprawl 2026 |
Old credentials do not expire on their own. The 2024 campaign against Snowflake customer instances, in which Mandiant and Snowflake notified about 165 potentially exposed organizations, used credentials stolen by infostealer malware as far back as 2020, and at least 79.7% of the accounts the attacker used had prior credential exposure (Mandiant, June 2024). The affected instances did not require multi-factor authentication, and in many cases the credentials had not been rotated for as long as four years. Datadog's recommendation is to replace long-lived keys with time-bound credentials: IAM roles and EKS Pod Identity on AWS, managed identities on Azure, and service accounts attached to workloads on Google Cloud.
Cloud misconfiguration statistics
Misconfiguration is close to universal in cloud accounts, but in the freshest incident data it is no longer the most common way in. It accounted for 21.0% of initial access into Google Cloud workloads in the second half of 2025, down from 29.4% in the first half, and for 7% of the cloud and SaaS intrusions Mandiant handled. The Cloud Security Alliance's 2026 survey moved "misconfiguration and inadequate change control" from first place in 2024 to fifth.
Table 5: Share of cloud accounts affected, by issue category, 12 months to July 2026
Issue category | AWS | Azure | Google Cloud |
|---|---|---|---|
Missing logging and alerting | 98% | 80% | 82% |
Weak IAM controls | 97% | 90% | 87% |
Permissive firewalls | 83% | 45% | 34% |
Exposed services | 76% | 64% | 8% |
Weak encryption | 49% | 35% | 8% |
Source: Intruder 2026 Cloud Security Index, misconfiguration data from 3,000 organizations, published 11 August 2026.
Table 6: Most common misconfigurations by cloud provider (share of accounts)
Provider | Most common misconfigurations | Source |
|---|---|---|
AWS | S3 buckets that do not enforce HTTPS (87%); permissive ingress to sensitive ports through network ACLs (84%); overly permissive network ACLs (83%); IAM policies that allow privilege escalation (83%) | Intruder 2026 Cloud Security Index |
Azure | Storage account key rotation not enabled (67%); storage account access keys enabled (66%); storage account public network access enabled (61%); Entra users without MFA (55%) | Intruder 2026 Cloud Security Index |
Google Cloud | OS Login MFA not enabled (77%); OS Login not enabled (76%); unused service accounts (75%); overly permissive service accounts (53%) | Intruder 2026 Cloud Security Index |
Weak IAM is the one category that gets worse with size: Intruder found weak IAM controls at 87% of organizations with up to 250 employees, 95% of midmarket organizations and 98% of large enterprises. Remediation is slowest in the middle. Small organizations fixed cloud issues within 7 to 16 days, organizations with 1,000 to 5,000 employees took 35 days, and enterprises with more than 10,000 employees took around 10 days.
Datadog's September 2025 posture data shows where secure defaults have changed the picture and where they have not:
Storage exposure is low where providers block it by default. One percent of S3 buckets are effectively public, down from 1.5%, and 83% are covered by S3 Block Public Access, a rise Datadog links partly to AWS blocking public access on new buckets since April 2023. On Azure, 1.3% of Blob Storage containers are effectively public and 58% sit in storage accounts that block public access.
Instance metadata protection lags without defaults. IMDSv2 is enforced on 49% of EC2 instances, up from 7% in 2022, and organizations enforce it on 66% of their instances on average. Fewer than 3% of organizations use the regional default setting, but where they do, enforcement reaches 95% or more.
Workloads carry too much power. Nearly one in five EC2 instances (19.4%) is overprivileged, and 23% of Google Cloud VMs have overly permissive access to their project.
Vendor access is a supply chain. The average organization runs 13 third-party integration roles in AWS, and 12.2% of third-party integrations are dangerously overprivileged, able to read all data in the account or take it over.
Red Hat's survey of 600 IT professionals, fielded in August and September 2025, puts the operational cost in context: 97% of organizations had at least one cloud-native security incident in the past year, misconfiguration of cloud infrastructure and known vulnerabilities led the incident types, 78% reported misconfigurations in the past 12 months, and 74% slowed or delayed deployments because of security concerns.
How much does a cloud data breach cost?
The average breach involving data stored in the public cloud cost US$5.38 million in IBM's Cost of a Data Breach Report 2026, up from US$4.68 million in the 2025 edition, while the share of breaches involving public cloud data held at 23%. Only breaches spanning on-premises, private cloud and public cloud cost more, at US$5.39 million.
Table 7: Breach cost by where the breached data was stored
Where the breached data was stored | Share of breaches, 2026 | Average cost, 2026 report | Average cost, 2025 report | Days to identify and contain, 2026 |
|---|---|---|---|---|
In all three locations (on premises, private cloud and public cloud) | 27% | US$5.39M | US$5.05M | 256 |
Public cloud | 23% | US$5.38M | US$4.68M | 251 |
Private cloud | 20% | US$4.62M | US$3.90M | 240 |
On premises | 30% | US$4.56M | US$4.01M | 244 |
Source: IBM Cost of a Data Breach Report 2026, Figures 7 and 8, research by Ponemon Institute. 2025 values are as shown in the 2026 report's Figure 7; the 2025 edition labelled the first category "across multiple types of environments".
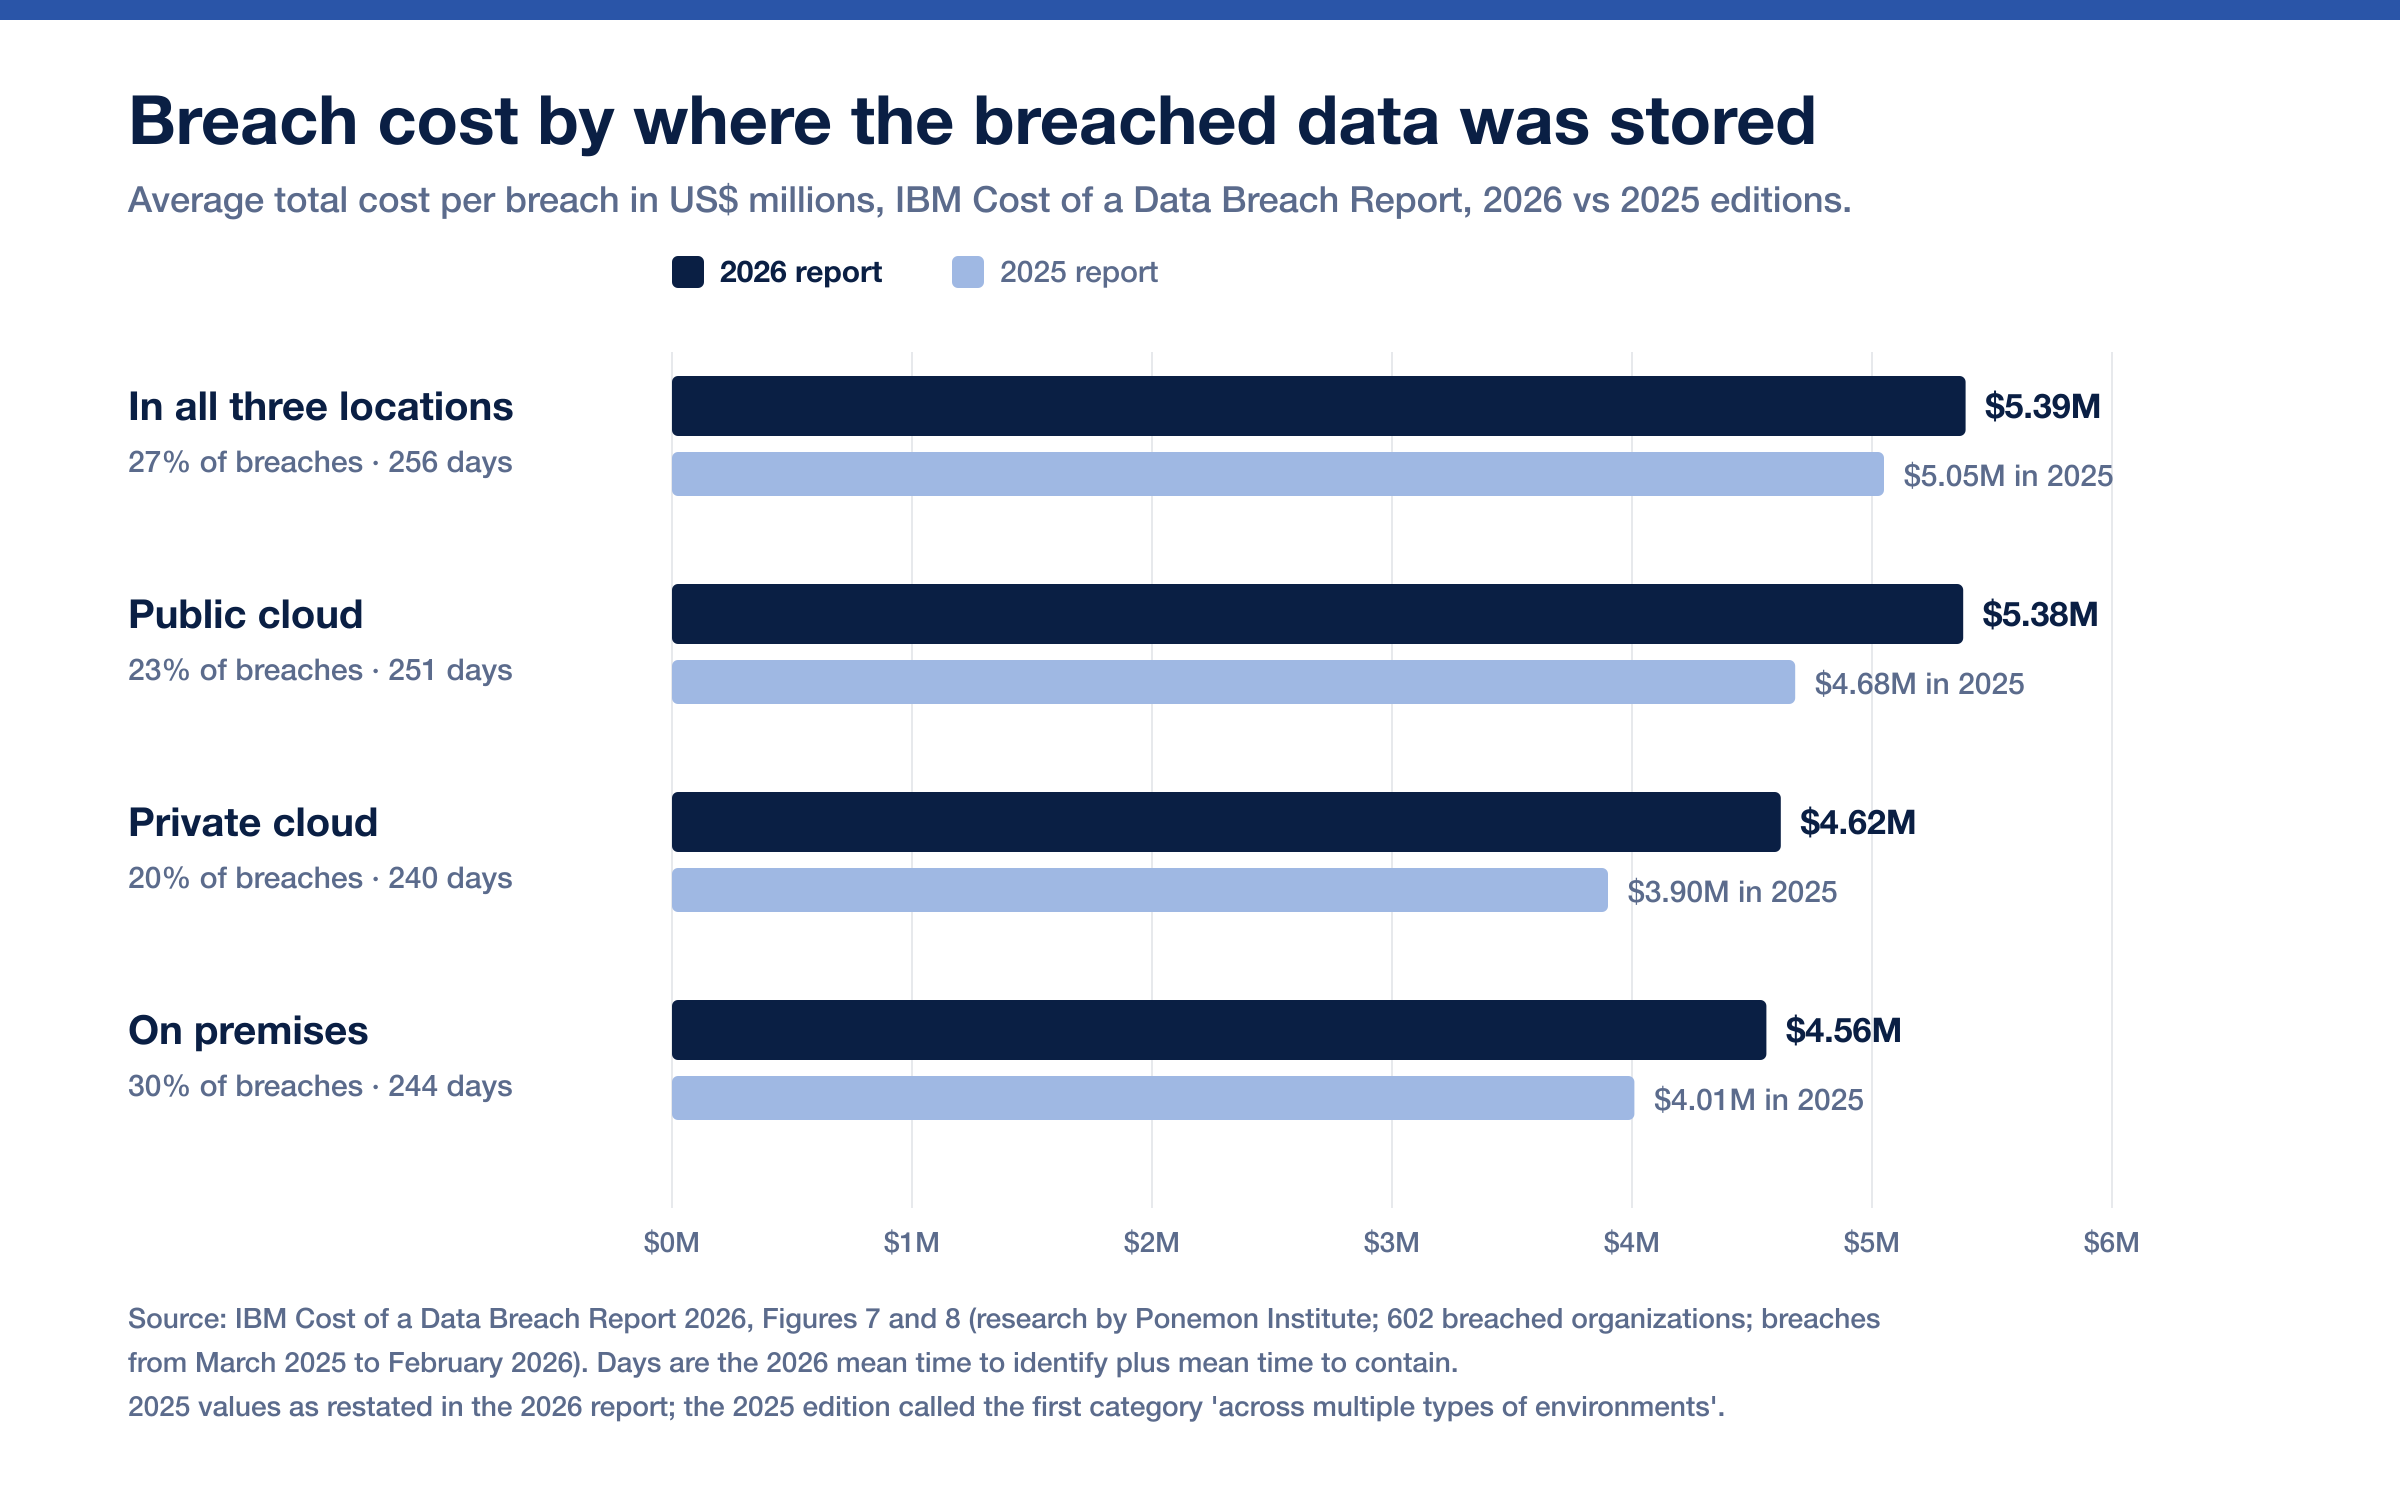
Figure 2: Average breach cost by where the breached data was stored, 2026 vs 2025 editions, with each category's share of 2026 breaches and days to identify and contain. Source: [IBM Cost of a Data Breach Report 2026](https://www.ibm.com/reports/data-breach) (602 breached organizations; breaches from March 2025 to February 2026).
Breaches spanning all three locations took 256 days to identify and contain, which IBM's 2026 report calls an improvement on the previous year's 277 days, but still the longest of any category. Public cloud breaches took 251 days in both editions, 184 of them spent identifying the breach. For context, the global average breach cost reached a record US$4.99 million in the 2026 edition, up 12%, and the US average a record US$11.5 million, up 13%.
IBM also isolates the factors that move breach cost up or down. Several map directly onto cloud programs.
Table 8: Cost factors relevant to cloud programs, against the US$4.99 million average
Factor | Effect on average breach cost |
|---|---|
DevSecOps approach | Lowered by US$253,805 |
Identity and access management (IAM) | Lowered by US$225,622 |
Offensive security testing (red teaming, pen or vulnerability testing) | Lowered by US$211,339 |
Secret lifecycle management tools | Lowered by US$163,668 |
Supply chain breach (business partner compromise) | Raised by US$227,250 |
Lack of visibility into applications (shadow IT) | Raised by US$201,165 |
Mismanaged secrets and keys | Raised by US$198,933 |
Excessive privileges and poor role management | Raised by US$177,313 |
Source: IBM Cost of a Data Breach Report 2026, Figure 33. IBM measured each of 30 factors in isolation against the global average.
Encryption remains a gap: 53% of breached organizations did not encrypt sensitive data at rest and in motion at the time of the breach, and another 10% were not sure.
How fast do attackers move in the cloud?
Attackers now move in minutes, and defenders still measure their response in weeks.
Table 9: The attacker clock and the defender clock
Event | Time | Source |
|---|---|---|
Hand-off from an initial access partner to a secondary group, median, all environments | 22 seconds (more than 8 hours in 2022) | Mandiant M-Trends 2026 |
Fastest eCrime breakout observed in 2025, all environments | 27 seconds | CrowdStrike 2026 Global Threat Report |
Data exfiltration began after initial access, one 2025 intrusion (environment not stated) | Within 4 minutes | CrowdStrike 2026 Global Threat Report |
Account takeover to data theft, one first-half 2026 intrusion | Under 5 minutes | CrowdStrike 2026 Threat Hunting Report |
Exposed AWS credentials to code execution, one November 2025 intrusion | 8 minutes (administrator access in under 10) | |
Average eCrime breakout time, 2025, all environments | 29 minutes | CrowdStrike 2026 Global Threat Report |
Share of observed proof-of-concept exploitation within 48 hours of release, January to June 2026, all environments | 88% | CrowdStrike 2026 Threat Hunting Report |
Cryptocurrency miners deployed after the React2Shell disclosure | About 48 hours | Google Cloud Threat Horizons H1 2026 |
Stolen GitHub token to full AWS administrator, one 2025 intrusion | Under 72 hours | Google Cloud Threat Horizons H1 2026 |
Mean time to exploit a vulnerability, 2025, all environments | An estimated minus seven days, before a patch exists | Mandiant M-Trends 2026 |
Median dwell time before detection, 2025, all environments | 14 days (11 days in 2024) | Mandiant M-Trends 2026 |
Cloud misconfiguration remediation, organizations with 1,000 to 5,000 employees | 35 days | Intruder 2026 Cloud Security Index |
Median time to fully remediate CISA Known Exploited Vulnerabilities, all environments | 43 days (32 days the year before) | Verizon 2026 Data Breach Investigations Report |
Time to resolve half of third-party cloud MFA findings | About a month; 23% of organizations fully remediated | Verizon 2026 Data Breach Investigations Report |
Time to resolve half of third-party cloud weak-password and permission findings | Almost eight months; 31% fully remediated | Verizon 2026 Data Breach Investigations Report |
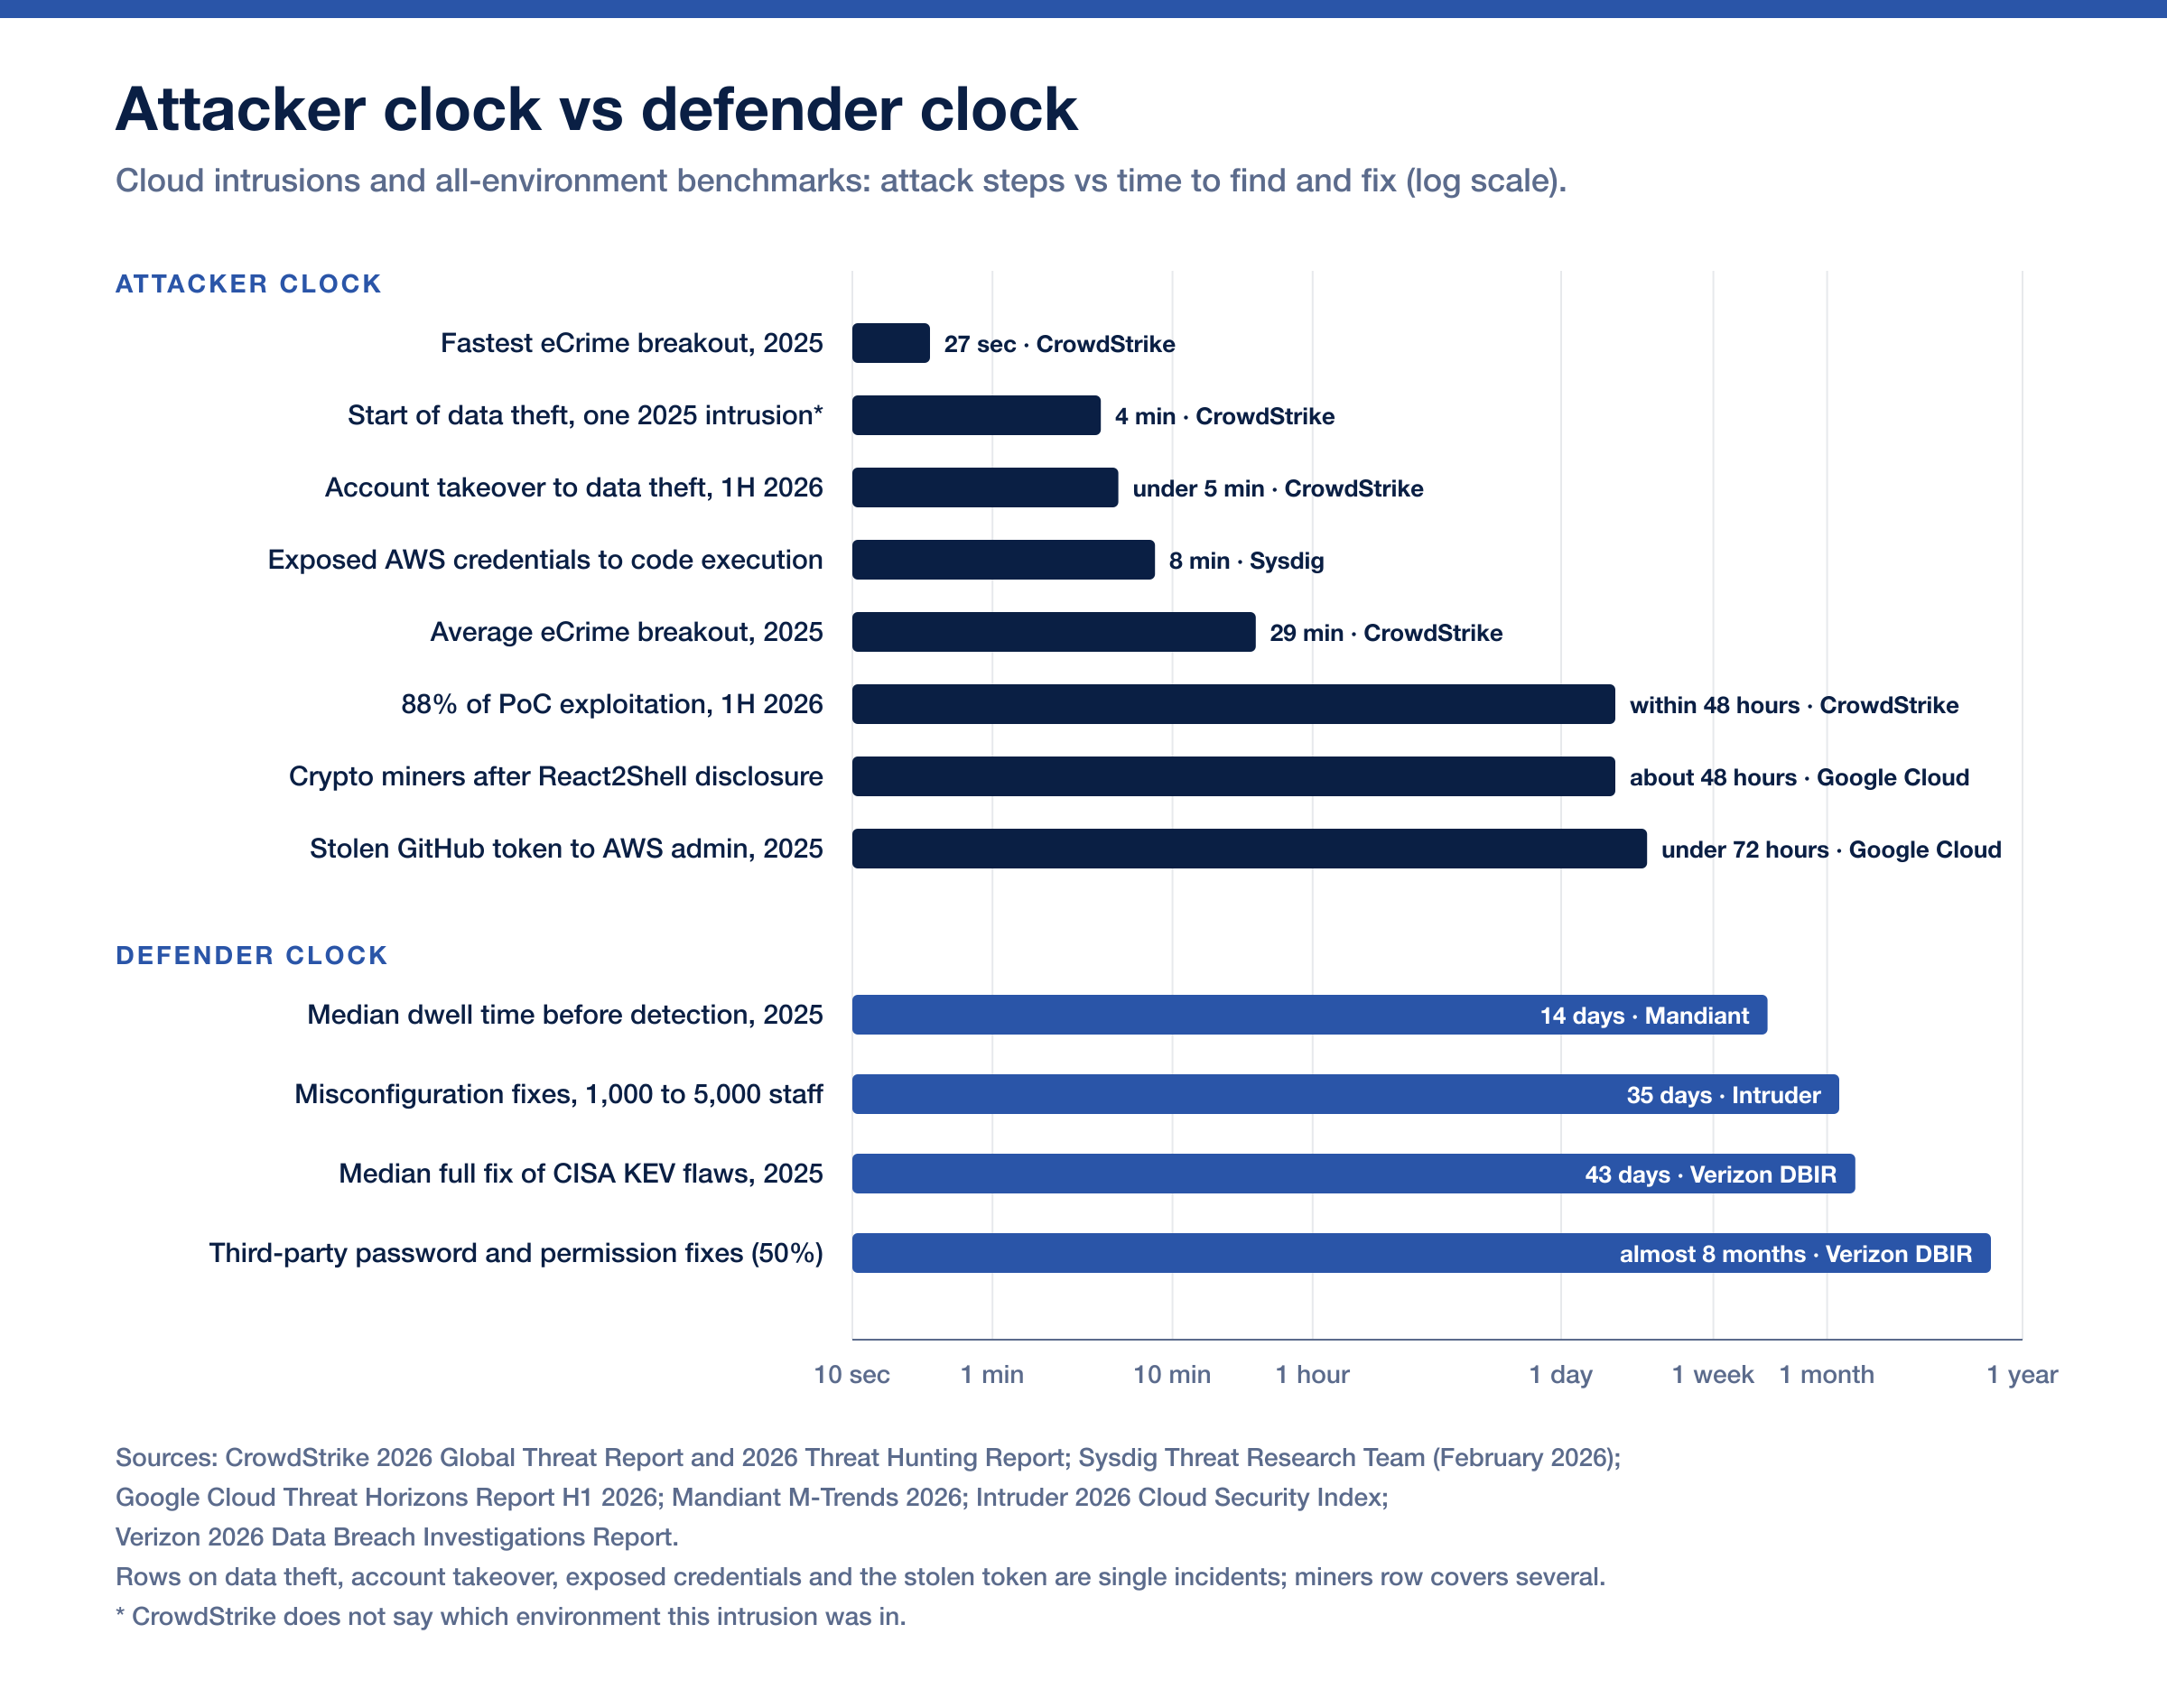
Figure 3: Attacker clock vs defender clock, cloud intrusions and all-environment benchmarks, log scale. Sources: CrowdStrike 2026 Global Threat Report and 2026 Threat Hunting Report; Sysdig Threat Research Team (February 2026); Google Cloud Threat Horizons Report H1 2026; Mandiant M-Trends 2026; Intruder 2026 Cloud Security Index; Verizon 2026 Data Breach Investigations Report. Rows on data theft, account takeover, exposed credentials and the stolen token describe single observed incidents, and the miners row covers several incidents Google observed; none are averages.
Two 2025 cases show what that speed looks like in a cloud account. In the intrusion Sysdig analyzed, the attacker found valid credentials in public S3 buckets, escalated through an overly permissive Lambda function role, moved across 19 AWS principals, then invoked Amazon Bedrock models and launched GPU instances, all starting with an eight-minute path from credential theft to code execution. In a case Mandiant responded to, a group Google tracks as UNC6426 used a developer's GitHub token stolen through a compromised npm package to abuse the trust between the victim's CI/CD pipeline and AWS, reaching full administrator rights in under 72 hours; the victim detected the activity three days after the initial compromise.
Defenders are automating to close the gap. Sysdig reports that more than 70% of security teams now use behavior-based runtime detections, and 140% more organizations than a year earlier automatically terminate suspicious processes when a detection fires. Mandiant found organizations detected 52% of intrusions internally in 2025, up from 43% in 2024.
Kubernetes and container security statistics
Kubernetes is where cloud workloads, and increasingly AI inference, run: 82% of container users run it in production, up from 66% in 2023, and 66% of organizations hosting generative AI models use it for some or all of their inference workloads, according to the Cloud Native Computing Foundation's 2025 Annual Cloud Native Survey.
Table 10: Kubernetes and container security statistics
Metric | Figure | Source |
|---|---|---|
Container users running Kubernetes in production | 82% (66% in 2023) | CNCF 2025 Annual Cloud Native Survey (628 respondents, September 2025) |
Organizations hosting generative AI models that use Kubernetes for inference | 66% | CNCF 2025 Annual Cloud Native Survey (628 respondents, September 2025) |
Managed clusters with an internet-exposed API server | 54% of GKE, 39% of EKS, 34% of AKS | |
EKS clusters with a dangerous node role | 13% | Datadog State of Cloud Security 2025 |
GKE clusters with a privileged service account | 10% | Datadog State of Cloud Security 2025 |
Vulnerable images in running workloads (critical or high severity in use) | About 5.5% | |
Change in running images with known exploits | Down nearly 75% year over year | Sysdig 2026 Cloud-Native Security and Usage Report |
Organizations using container image signing and verification | About half | |
Organizations with a well-defined cloud-native security strategy | 39% | Red Hat, 2026 edition |
Organizations that slowed or delayed deployments over security concerns | 74% | Red Hat, 2026 edition |
A dangerous node role, in Datadog's definition, is one with full administrator access, privilege escalation paths, overly broad data access or the ability to move laterally across all workloads in the account, so an attacker who compromises the cluster can pivot into the wider AWS account. Google Cloud's H1 2026 report documents that path in a 2025 case it attributes with moderate confidence to the North Korean group UNC4899: the attackers pivoted from a developer's workstation into the victim's Google Cloud environment, abused a pod running in privileged mode, found static database credentials stored in a pod's environment variables, and withdrew several million dollars in cryptocurrency. Google's recommendations from that case are defender basics: restrict privileged containers, keep secrets out of environment variables, and replace static credentials with workload identity federation.
AI workloads in the cloud: the newest attack surface
AI runs on cloud infrastructure, so AI security incidents are increasingly cloud security incidents. In IBM's 2026 study, 21% of breached organizations reported a security incident involving an AI model or application, up from 13% a year earlier, and 92% of those lacked proper AI access controls. Only 40% of organizations reported using access controls on AI models and data.
Table 11: AI-related breaches by incident type, IBM Cost of a Data Breach Report 2026
AI-related breach type | Share of AI-related breaches, 2026 | Share, 2025 | Average cost, 2026 |
|---|---|---|---|
Cloud security misconfigurations | 27% | Not asked in 2025 | US$5.25M |
Compromise of connected apps, APIs or plug-ins | 27% | 30% | US$4.37M |
Data poisoning | 26% | 15% | US$4.32M |
Model inversion | 25% | 24% | US$6.07M |
Prompt injection | 25% | 17% | US$5.89M |
Source: IBM Cost of a Data Breach Report 2026, Figure 27. IBM describes the most common causes as weaknesses in surrounding systems rather than in the models themselves.
The identity and secrets data repeats the pattern:
AI services hold standing privileges. Tenable found 18% of organizations had granted AI services administrative permissions that are rarely audited, and that 73% of Amazon SageMaker roles and 70% of Amazon Bedrock agent roles were inactive, privileges waiting to be claimed (Tenable, February 2026).
AI dependencies are now production code. For 70% of organizations, AI and Model Context Protocol (MCP) packages are part of the production cloud stack, according to Tenable, and Sysdig counted 25 times more AI-specific packages than a year earlier, with only 1.5% of those assets publicly exposed.
AI credentials leak fastest. GitGuardian found 1,275,105 AI service secrets in public GitHub commits in 2025, up 81%, and 24,008 unique secrets in MCP configuration files, 2,117 of them valid credentials.
Attackers abuse AI access for profit. CrowdStrike observed one LLMjacking campaign generate nearly 200,000 API requests in two minutes, counted LLM abuse among the drivers of a 171% rise in cloud-conscious eCrime, and found adversaries exploited legitimate GenAI tools at more than 90 organizations in 2025.
Governance trails adoption. Security incidents involving shadow AI more than doubled to 43% in IBM's 2026 study, from 20%, at an average cost of US$5.39 million. In Red Hat's survey, 79% of respondents said generative AI is creating new security challenges in their cloud environments and 59% of organizations had no documented AI usage policy.
The Cloud Security Alliance reached the same conclusion from the practitioner side: AI-enhanced attacks entered its 2026 top threats list at second place and AI system compromise at sixth, the first time either appeared.
Shared responsibility: where cloud breaches actually happen
Every major provider draws the same line. AWS describes its role as security "of" the cloud and the customer's as security "in" the cloud (AWS); Microsoft states that for all cloud deployment types, customers own their data and identities (Microsoft); and Google Cloud argues the model "stops short" of helping customers and proposes shared fate in its place, with Google also supplying best-practice guidance and secured infrastructure code (Google Cloud). Canada's federal guidance spells out the customer's share by service model.
Table 12: Customer and provider responsibilities by cloud service model
Service model | Customer (consumer organization) is responsible for | Cloud service provider is responsible for |
|---|---|---|
Infrastructure as a service (IaaS) | User access and identity, data, applications and platform | Resource abstraction and control, hardware and facility |
Platform as a service (PaaS) | User access and identity, data and applications | Platform, resource abstraction and control, hardware and facility |
Software as a service (SaaS) | User access and identity, and data | Applications, platform, resource abstraction and control, hardware and facility |
Source: Canadian Centre for Cyber Security, Cloud security risk management (ITSM.50.062), which also states that organizations remain ultimately responsible and accountable for the risks of the cloud services they use.
The breach data falls on the customer's side of that line. The Verizon 2026 Data Breach Investigations Report recommends focusing first on the authentication and authorization layers, which it says usually sit "on an organization's end of the responsibility matrix" of cloud environments, and in one of its datasets 37% of organizations had an IaaS admin account with MFA disabled, against 14% on Snowflake. Google reports that the software exploitation it saw in the second half of 2025 did not involve its core infrastructure. Customer-side third-party access widens the gap: Tenable found 53% of organizations had given third parties external accounts that can assume highly risky permissions, and 14% expose more than 75% of their cloud resources that way. Verizon found only 23% of third-party organizations fully remediated missing or improperly secured MFA on their cloud accounts.
Regulators have started to make the customer side explicit. CISA's Binding Operational Directive 25-01, issued on 17 December 2024 after incidents in which improperly configured cloud security controls resulted in actual compromises, required US federal civilian agencies to implement mandatory secure configuration baselines for Microsoft 365 by 20 June 2025. CISA and the NSA published five joint cloud security information sheets in March 2024 covering identity and access management, key management, network segmentation and encryption, data security, and managed service provider risk.
What this means for defenders
Test identity attack paths, not only configurations. With identity behind 83% of the cloud and SaaS intrusions Mandiant handled and valid account abuse in 35% of CrowdStrike's cloud incidents, a cloud penetration test should start from a stolen identity, such as a leaked access key, a phished Entra ID session or an over-scoped OAuth grant, and prove what each can reach. Our guides to cloud IAM penetration testing and scoping an Azure and Entra ID penetration test show how to scope that work.
Retire long-lived credentials and switch on secure defaults. Fifty-nine percent of AWS IAM users hold active access keys older than a year, 65% of organizations hold ghost secrets, and IMDSv2 enforcement passes 95% only where the regional default is on. Short-lived credentials, workload identity federation and account-level guardrails remove whole rows from the misconfiguration tables above.
Shrink the exploitation window on internet-facing workloads. Software-based entry reached 44.5% of initial access into Google Cloud workloads, and across all environments CrowdStrike saw 88% of observed proof-of-concept exploitation happen within 48 hours. Google recommends targets of under 24 hours to mitigate with a virtual patch and under 72 hours to fully patch. Test exposed workloads after every significant change, not only at the annual review; cloud penetration testing run as a continuous program alongside an annual test covers both.
Treat Kubernetes and AI services as cloud identity problems. Exposed API servers on 54% of GKE clusters, dangerous node roles on 13% of EKS clusters and AI services with rarely audited admin rights at 18% of organizations can each turn a workload compromise into an account compromise. Our guides to Kubernetes penetration test scope and cost and AWS Bedrock penetration testing cover the cluster-to-cloud and AI-to-cloud paths, and AI and LLM penetration testing covers the applications on top.
Keep evidence your auditors and customers can read. IBM found offensive security testing lowered the average breach cost by US$211,339. Your provider's own audit reports cover its side of the line, not yours, as our guide to why a provider's SOC 2 report is not your cloud pentest evidence explains, so customer-side testing is what shows your controls work.
How Stingrai tests cloud environments against these attacks
Stingrai is a global CREST-accredited penetration testing services company founded in Toronto, Canada in 2021, trusted by companies from startups to enterprises to meet audit requirements for SOC 2, ISO 27001, CMMC, PCI DSS and HIPAA. OSCE³, OSWE, OSEP, CREST CRT certified pentesters, who are also world-class security researchers and bug bounty hunters. Choose from fully human-led or hybrid (AI agents plus human penetration testers) engagements across web, API, mobile, AI and LLM, cloud, network, Active Directory and social engineering penetration tests and red team engagements.
For cloud environments, that means human-led cloud penetration testing by two named penetration testers from a team holding OSCE³, OSWE, OSEP, CREST CRT and CISSP, working from the control plane down to the workload. On AWS they test cross-account role assumption, resource and bucket policies, instance metadata abuse, and Lambda, API Gateway and EKS. In Azure and Entra ID they test app registrations, service principals, consent grants, Conditional Access gaps and hybrid-join trust. On Google Cloud they test service account impersonation chains, IAM Conditions, GKE and Cloud Run. Those are the identity paths, exposed services and cluster-to-cloud pivots the statistics above keep pointing to, and our Google Cloud scoping guide maps the GCP-native surface in detail. The team holds 18 published CVEs, and Stingrai is rated 5.0 on Clutch across 20 reviews. Findings are posted to the PTaaS portal as they are confirmed, each with a working proof of concept and prioritized remediation guidance. Every engagement includes retesting, and human-led and hybrid engagements also include an attestation letter. Engagements run as one-time annual tests or as continuous programs that retest as your cloud estate changes, and the reports give you pentest evidence for SOC 2, ISO 27001, PCI DSS, HIPAA and FedRAMP programs. Cloud scopes are quoted per environment through the quote form. For a single web application and its APIs running in your cloud, published prices are US$3,000 per assessment or US$650 per month for the Autonomous Pentest by Snipe, Stingrai's AI agent for web applications and APIs, which carries the No High or Critical Finding = Don't Pay guarantee, and US$6,800 per assessment or US$1,275 per month for the Hybrid Pentest, in which Snipe and penetration testers test together; the monthly prices are for 12-month continuous plans (pricing). Buyers comparing providers can start with our ranking of the best cloud penetration testing companies, and our guide to cloud penetration testing rules of engagement explains what AWS, Azure and Google Cloud allow testers to do.
Frequently Asked Questions
What is the most common cause of cloud security breaches in 2026?
Identity compromise is the most common cause. Google Cloud's Cloud Threat Horizons Report H1 2026 found threat actors exploited identity issues to gain initial access in 83% of the cloud and SaaS intrusions Mandiant handled in the second half of 2025, led by stolen credentials (21%), compromised third parties (21%) and voice phishing (17%). Inside Google Cloud workloads specifically, software exploitation led at 44.5% of initial access, ahead of weak or absent credentials at 27.2%, so patching customer-run software matters as much as identity hygiene.
What is the average cost of a cloud data breach in 2026?
The average breach involving data stored in the public cloud cost US$5.38 million in the IBM Cost of a Data Breach Report 2026, up from US$4.68 million in the 2025 edition. Breaches involving data spread across on-premises, private cloud and public cloud cost US$5.39 million and took 256 days to identify and contain, while on-premises breaches cost US$4.56 million. The global average across all breaches was a record US$4.99 million, based on 602 organizations breached between March 2025 and February 2026.
What percentage of cloud breaches are caused by misconfiguration?
It depends on the dataset, and misconfiguration is no longer the leading cause in the freshest incident data. Misconfiguration accounted for 21.0% of initial access into Google Cloud workloads in the second half of 2025, down from 29.4% in the first half, and for 7% of the cloud and SaaS intrusions Mandiant handled. Misconfigurations remain near universal, though: the Intruder 2026 Cloud Security Index found weak IAM controls in 87% to 97% of accounts across AWS, Azure and Google Cloud, and 78% of respondents to Red Hat's survey of 600 IT professionals (August to September 2025) reported misconfigurations in the past 12 months.
How fast do attackers move once they are inside a cloud environment?
Across all the environments CrowdStrike tracks, not only cloud, the average eCrime breakout time, from initial access to lateral movement, was 29 minutes in 2025 and the fastest was 27 seconds, according to the CrowdStrike 2026 Global Threat Report. Inside cloud accounts specifically, a November 2025 AWS intrusion analyzed by Sysdig went from credentials exposed in public S3 buckets to administrator access in under 10 minutes. Defenders are slower: Mandiant measured a 14-day median dwell time across its 2025 investigations, and the Verizon 2026 Data Breach Investigations Report found a 43-day median to fully remediate known exploited vulnerabilities.
How exposed are Kubernetes clusters in the cloud?
Many managed Kubernetes control planes are reachable from the internet. The Datadog State of Cloud Security 2025 found API servers exposed in 54% of GKE clusters, 39% of EKS clusters and 34% of AKS clusters, and 13% of EKS clusters had a dangerous node role that could let an attacker who compromises the cluster reach the wider AWS account. Kubernetes now runs in production for 82% of container users, according to the CNCF's 2025 survey of 628 respondents, which makes those cluster-to-cloud paths a mainstream risk.
Are AI workloads in the cloud being breached?
Yes. In the IBM Cost of a Data Breach Report 2026, 21% of breached organizations reported a security incident involving an AI model or application, up from 13%, and cloud misconfigurations affecting AI workloads caused 27% of those breaches at an average cost of US$5.25 million. Ninety-two percent of the organizations with an AI-related breach lacked proper AI access controls. Tenable found 18% of organizations had granted AI services administrative permissions that are rarely audited.
Who is responsible for cloud security under the shared responsibility model?
The provider secures the infrastructure that runs the cloud, and the customer secures what it deploys and configures in it. AWS calls this security of the cloud versus security in the cloud, Microsoft states that customers own their data and identities in every deployment type, and the Canadian Centre for Cyber Security assigns user access, identity and data to the customer in IaaS, PaaS and SaaS alike. The breach data sits on the customer's side of that line: 37% of organizations in one Verizon 2026 Data Breach Investigations Report dataset had an IaaS admin account with MFA disabled, and Google says the software exploitation it observed in the second half of 2025 did not involve its core infrastructure.
How does cloud security differ between AWS, Azure and Google Cloud?
Each provider fails in different places. In the Intruder 2026 Cloud Security Index of 3,000 organizations, exposed services affected 76% of AWS accounts, 64% of Azure accounts and 8% of Google Cloud accounts, and permissive firewalls affected 83%, 45% and 34%. Weak IAM controls were near universal everywhere, at 97%, 90% and 87%. The most common single issues were S3 buckets that do not enforce HTTPS on AWS (87%), storage account key rotation not enabled on Azure (67%) and OS Login MFA not enabled on Google Cloud (77%).
Where can I get the latest cloud security statistics?
The main recurring sources are Google Cloud's twice-yearly Cloud Threat Horizons Report, Mandiant's M-Trends each spring, the CrowdStrike Global Threat Report each February and Threat Hunting Report each August, the Verizon Data Breach Investigations Report each spring, the IBM Cost of a Data Breach Report each July, the Datadog, Sysdig and Tenable cloud reports, and the Cloud Security Alliance's Top Threats survey. The references below link every edition used in this post.
References
Google Cloud. Cloud Threat Horizons Report H1 2026. March 2026. https://cloud.google.com/security/report/resources/cloud-threat-horizons-report-h1-2026. Initial access vectors in Google Cloud workloads and in Mandiant cloud and SaaS engagements for the second half of 2025, with case studies on Kubernetes and CI/CD compromise.
Mandiant (Google Cloud). M-Trends 2026: Data, Insights, and Strategies From the Frontlines. 23 March 2026. https://cloud.google.com/blog/topics/threat-intelligence/m-trends-2026. Dwell time, initial infection vectors, hand-off times and time to exploit from Mandiant investigations in 2025.
Mandiant (Google Cloud). M-Trends 2026 Executive Edition. March 2026. https://services.google.com/fh/files/misc/m-trends-2026-executive-edition-en.pdf. Summary metrics for investigations from 1 January to 31 December 2025, including the decline of email phishing.
Mandiant (Google Cloud). UNC5537 Targets Snowflake Customer Instances for Data Theft and Extortion. 10 June 2024. https://cloud.google.com/blog/topics/threat-intelligence/unc5537-snowflake-data-theft-extortion. Campaign analysis of credential-based access to cloud data platform accounts without MFA.
IBM. Cost of a Data Breach Report 2026. 29 July 2026. https://www.ibm.com/reports/data-breach. Breach cost by data storage location, AI-related breaches and cost factors from 602 breached organizations, researched by Ponemon Institute.
IBM. IBM Study: One in Four Malicious Breaches are AI-Enabled, Costing Companies $6 Million on Average. 29 July 2026. https://newsroom.ibm.com/2026-07-29-ibm-study-one-in-four-malicious-breaches-are-ai-enabled,-costing-companies-6-million-on-average. Release summarizing the 2026 study, including the causes of AI-related breaches.
Verizon. 2026 Data Breach Investigations Report. 19 May 2026. https://www.verizon.com/business/resources/reports/dbir/. Breach patterns for incidents from 1 November 2024 to 31 October 2025, including third-party cloud exposure and remediation data.
CrowdStrike. CrowdStrike 2026 Global Threat Report: Evasive Adversary Wields AI. 24 February 2026. https://www.crowdstrike.com/en-us/blog/crowdstrike-2026-global-threat-report-findings/. Breakout time, cloud-conscious intrusions and valid account abuse in 2025.
CrowdStrike. 2026 CrowdStrike Global Threat Report: AI Accelerates Adversaries and Reshapes the Attack Surface. 24 February 2026. https://www.crowdstrike.com/en-us/press-releases/2026-crowdstrike-global-threat-report/. Release with cloud-conscious intrusion growth by actor type.
CrowdStrike. CrowdStrike 2026 Threat Hunting Report: AI is Now Embedded Across Modern Adversary Operations. 3 August 2026. https://www.crowdstrike.com/en-us/press-releases/crowdstrike-2026-threat-hunting-report/. Threat hunting findings for 1 July 2025 to 30 June 2026, including cloud-conscious eCrime.
CrowdStrike. CrowdStrike 2026 Threat Hunting Report: Exploitation Window Closes as AI Use Accelerates. 3 August 2026. https://www.crowdstrike.com/en-us/blog/crowdstrike-2026-threat-hunting-report/. Exploitation timelines, vishing growth and LLMjacking observations.
Microsoft. Microsoft Digital Defense Report 2025 (Microsoft On the Issues). 16 October 2025. https://blogs.microsoft.com/on-the-issues/2025/10/16/mddr-2025/. Identity attack trends from July 2024 to June 2025.
Datadog. State of Cloud Security (2025 edition). October 2025. https://www.datadoghq.com/state-of-cloud-security/. Posture data from thousands of AWS, Azure and Google Cloud customer organizations, collected in September 2025.
Sysdig. Sysdig 2026 Cloud-Native Security Report Signals That Human-Driven Security Is Coming to an End. 16 April 2026. https://www.sysdig.com/press-releases/2026-usage-report. Release for the 2026 Cloud-Native Security and Usage Report.
Sysdig. Cloud security has hit its human limits: Key takeaways from the 2026 Cloud-Native Security and Usage Report. 16 April 2026. https://www.sysdig.com/blog/sysdig-2026-cloud-native-security-and-usage-report. Vulnerability, runtime detection and AI package findings.
Sysdig. Risky identities continue to plague cloud infrastructures. 22 September 2026. https://www.sysdig.com/blog/risky-identities-continue-to-plague-cloud-infrastructures. Machine and human identity risk from the 2026 report data.
Sysdig Threat Research Team. AI-assisted cloud intrusion achieves admin access in 8 minutes. 3 February 2026. https://www.sysdig.com/blog/ai-assisted-cloud-intrusion-achieves-admin-access-in-8-minutes. Analysis of an AWS intrusion observed on 28 November 2025.
Tenable. Tenable Research Reveals Growing AI Exposure Gap Fueled by Supply Chain Risks and Lack of Identity Controls. 19 February 2026. https://www.tenable.com/press-releases/tenable-research-reveals-growing-ai-exposure-gap-fueled-by-supply-chain-risks-and-lack-of-identity-controls. Release for the Cloud and AI Security Risk Report 2026, telemetry from April to October 2025.
Tenable. The Cloud and AI Velocity Trap: Why Governance Is Falling Behind Innovation. 19 February 2026. https://www.tenable.com/blog/cloud-ai-research-report-2026-governance-vs-innovation. AI service roles, non-human identities and third-party access findings.
Intruder. 2026 Cloud Security Index: How risk differs across AWS, Azure, and Google Cloud. 11 August 2026. https://www.intruder.io/blog/cloud-security-index. Misconfiguration prevalence and remediation times from 3,000 organizations over the 12 months to July 2026.
Red Hat. The state of cloud-native security report: 2026 edition. 22 December 2025. https://www.redhat.com/en/resources/state-of-cloud-native-security-ebook. Survey of 600 IT professionals at companies with 100 or more employees, August to September 2025.
Cloud Security Alliance. Top Threats to Cloud Computing Survey Report 2026. 12 August 2026. https://cloudsecurityalliance.org/artifacts/top-threats-cloud-computing-2026. Expert ranking of the 11 most critical cloud security issues.
Cloud Security Alliance. Artificial Intelligence (AI) Emerges as an Attack Enabler and Target in Cloud Security Alliance's 2026 Top Threats Report. 13 August 2026. https://cloudsecurityalliance.org/press-releases/2026/08/13/ai-emerges-as-an-attack-enabler-and-target-in-csa-2026-top-threats-report. Full 2026 ranking with 2024 positions and survey method.
Cloud Native Computing Foundation. Kubernetes Established as the De Facto Operating System for AI as Production Use Hits 82% in 2025 CNCF Annual Cloud Native Survey. 20 January 2026. https://www.cncf.io/announcements/2026/01/20/kubernetes-established-as-the-de-facto-operating-system-for-ai-as-production-use-hits-82-in-2025-cncf-annual-cloud-native-survey/. Kubernetes production adoption and use for AI inference.
GitGuardian. The State of Secrets Sprawl 2026. 17 March 2026. https://blog.gitguardian.com/the-state-of-secrets-sprawl-2026/. Hardcoded secrets in public GitHub commits in 2025 and the remediation gap.
Cybersecurity and Infrastructure Security Agency. BOD 25-01: Implementing Secure Practices for Cloud Services. 17 December 2024. https://www.cisa.gov/news-events/directives/bod-25-01-implementing-secure-practices-cloud-services. Mandatory secure configuration baselines for federal civilian cloud tenants.
Cybersecurity and Infrastructure Security Agency. CISA and NSA Release Cybersecurity Information Sheets on Cloud Security Best Practices. 7 March 2024. https://www.cisa.gov/news-events/alerts/2024/03/07/cisa-and-nsa-release-cybersecurity-information-sheets-cloud-security-best-practices. Five joint cloud security information sheets.
Canadian Centre for Cyber Security. Cloud security risk management (ITSM.50.062). March 2019. https://www.cyber.gc.ca/en/guidance/cloud-security-risk-management-itsm50062. Division of security responsibilities between cloud consumers and providers by service model.
Amazon Web Services. Shared Responsibility Model. Accessed 1 October 2026. https://aws.amazon.com/compliance/shared-responsibility-model/. AWS's definition of security of and in the cloud.
Microsoft. Shared responsibility in the cloud. Accessed 1 October 2026. https://learn.microsoft.com/en-us/azure/security/fundamentals/shared-responsibility. Customer and Microsoft responsibilities by deployment type.
Google Cloud. Shared responsibilities and shared fate on Google Cloud. Last reviewed 21 August 2023. https://cloud.google.com/architecture/framework/security/shared-responsibility-shared-fate. Google Cloud's shared fate model.
Related reading
Best cloud penetration testing companies (2026): providers ranked on AWS, Azure and Google Cloud depth.
Cloud and Kubernetes penetration testing: scope and cost: the layers a cloud test covers and what drives the price.
How to scope a Google Cloud penetration test: the GCP-native surface an AWS-centric scope misses.
How to scope an Azure and Entra ID penetration test: asset inventory and identity attack paths.
Cloud IAM penetration testing: proving the identity attack paths posture tools only flag.
Your cloud provider's SOC 2 report is not your cloud pentest evidence: what auditors expect on the customer side of the line.