




The average data breach now costs a record US$4.99 million globally and US$11.5 million in the United States, per the IBM Cost of a Data Breach Report 2026. That global figure is up 12% year over year and reverses the one-year dip to US$4.44 million that IBM recorded in 2025, setting a new all-time high. In parallel, the Verizon 2026 Data Breach Investigations Report analyzed more than 22,000 confirmed breaches and found vulnerability exploitation, not stolen credentials, as the single most common way in. The headline for 2026 is simple: breaches got more expensive again, attackers moved faster, and artificial intelligence became a line item on the invoice.
Three forces are pulling those numbers. First, AI-enabled attacks: one in four malicious breaches was AI-enabled in 2026, a 56% jump, costing an average of US$6 million (IBM, 2026). Second, unmanaged exposure: only 26% of known-exploited vulnerabilities were fully remediated in the DBIR window, down from 38% (Verizon, 2026). Third, sheer volume: US victims filed 1,008,597 complaints reporting US$20.877 billion in losses, up 26% year over year (FBI IC3, 2025). For CISOs, security buyers, insurers and journalists, those are the four anchor numbers of the year.
This post is the Stingrai research team's canonical 2026 reference for data breach cost, frequency, causes and detection timelines. It aggregates 40-plus figures from four primary publishers: IBM (with the Ponemon Institute), Verizon, the FBI Internet Crime Complaint Center, and Mandiant. Lead cost data is full-year 2025 breach telemetry published in the 2026 reports, the freshest available; primary publishers have not released full-year 2026 breach datasets as of August 2026, so any "2026" cost figure describes breaches studied through early 2026. Every statistic below carries its source, year and methodology window so any claim can be audited inline against the original publisher.
Key data breach statistics at a glance (2026)
Global average breach cost (2026): US$4.99M, a record, up 12% year over year (IBM Cost of a Data Breach 2026).
US average breach cost (2026): US$11.5M, more than double the global figure (IBM, 2026).
Most expensive industry (2026): healthcare at US$6.64M, its 13th consecutive year at the top (IBM, 2026).
Top initial access vector (2026): vulnerability exploitation, 31% of breaches, now ahead of credential abuse (Verizon 2026 DBIR).
Ransomware presence (2026): ransomware appeared in 48% of breaches, up from 44% (Verizon, 2026).
Human element (2026): 62% of breaches involved a person, through error, social engineering or misuse (Verizon, 2026).
Third-party involvement (2026): 48% of breaches involved a third party, a 60% year-over-year increase (Verizon, 2026).
AI-enabled breaches (2026): one in four malicious breaches was AI-enabled, costing US$6M on average (IBM, 2026).
Time to identify and contain (2026): 247 days on average across the full breach lifecycle (IBM, 2026).
Median attacker dwell time (2025): 14 days, up from 11 (Mandiant M-Trends 2026).
US cybercrime losses (2025): US$20.877B across 1,008,597 complaints, up 26% (FBI IC3, 2025).
Business email compromise losses (2025): US$3.046B, the second-costliest cybercrime category (FBI IC3, 2025).
Key takeaways
The "credentials are king" era paused in 2026. For years, stolen credentials led the way into networks. In the 2026 DBIR, credential abuse as the initial access vector fell to 13%, while vulnerability exploitation rose to 31% and took the top spot (Verizon, 2026). Credentials still matter, they show up somewhere in 39% of breaches, but the front door of 2026 is an unpatched vulnerability.
Breach costs rebounded to a record after a rare decline. IBM's global average fell 9% to US$4.44M in 2025, the first drop in five years. In 2026 it snapped back 12% to US$4.99M, driven by detection, escalation and lost-business costs (IBM, 2026). The US average reached US$11.5M, more than double the global number.
AI is now a measurable cost, not a forecast. One in four malicious breaches was AI-enabled in 2026, and those breaches cost about US$1M more than average (IBM, 2026). Separately, unapproved "shadow AI" tools figured in 43% of security incidents, and close to seven in ten breached organizations had no AI governance policy in place.
Detection is still measured in months, not minutes. The full breach lifecycle averaged 247 days in 2026 (IBM, 2026), and even Mandiant's frontline responders put median attacker dwell time at 14 days (Mandiant, 2026). Attackers, by contrast, now hand off access in a median of 22 seconds.
Your risk increasingly lives outside your walls. Third-party involvement in breaches jumped 60% year over year to 48% of all breaches (Verizon, 2026). A supply chain breach, in which a business partner is compromised, is the single biggest cost amplifier in IBM's data, adding US$227,250 to the average breach (IBM, 2026).
Methodology and sources
This reference draws only on primary publishers, each with a transparent methodology and a stated data window:
IBM Cost of a Data Breach Report 2026, conducted by the Ponemon Institute, published July 2026. Based on 602 organizations that experienced breaches between March 2025 and February 2026. Source for all cost figures (global, US, by industry, by attack vector, breach lifecycle, AI-related costs).
Verizon 2026 Data Breach Investigations Report (DBIR), published May 2026. Analyzed more than 31,000 security incidents and 22,000 confirmed breaches across 145 countries, for incidents between 1 November 2024 and 31 October 2025. Source for breach causes, patterns, vector shares, ransomware presence and third-party involvement.
FBI Internet Crime Complaint Center (IC3) 2025 Annual Report, published 2026. Aggregates 1,008,597 public complaints filed in calendar-year 2025. Source for US complaint volume, reported losses, BEC and ransomware figures.
Mandiant (Google Cloud) M-Trends 2026, published spring 2026, based on more than 500,000 hours of frontline incident response in 2025. Source for dwell time, detection source and initial infection vectors.
The research cutoff for this page is 21 August 2026. Where two reputable sources disagreed on a figure, the primary publisher's number was used and the outlier dropped. Any statistic that could not be traced to a named primary publisher on verification was removed rather than estimated or softened with "approximately." Reported-loss figures from the FBI IC3, especially for ransomware, are acknowledged undercounts because many victims report no dollar amount and losses exclude downtime and remediation.
Because different publishers count different things, this page keeps their figures in separate lanes rather than blending them. IBM measures the cost of breaches at surveyed organizations. Verizon measures the composition of confirmed breaches in its caseload. The FBI measures publicly reported US complaints. Read together they triangulate the same story; read as one pooled number they would mislead.
How much does a data breach cost in 2026?
The average data breach costs US$4.99 million globally in 2026 and US$11.5 million in the United States (IBM Cost of a Data Breach 2026). The global figure is a record and a 12% year-over-year increase, notable because it follows the first decline IBM had recorded in five years. In 2025 the global average had fallen 9% to US$4.44 million as faster investigations pulled costs down; in 2026 detection, escalation and lost-business costs pushed them back up.
The US premium is structural. American breaches cost more than double the global average because of class-action litigation, 50 separate state breach-notification regimes, and a concentration of the two most expensive industries, healthcare and financial services.
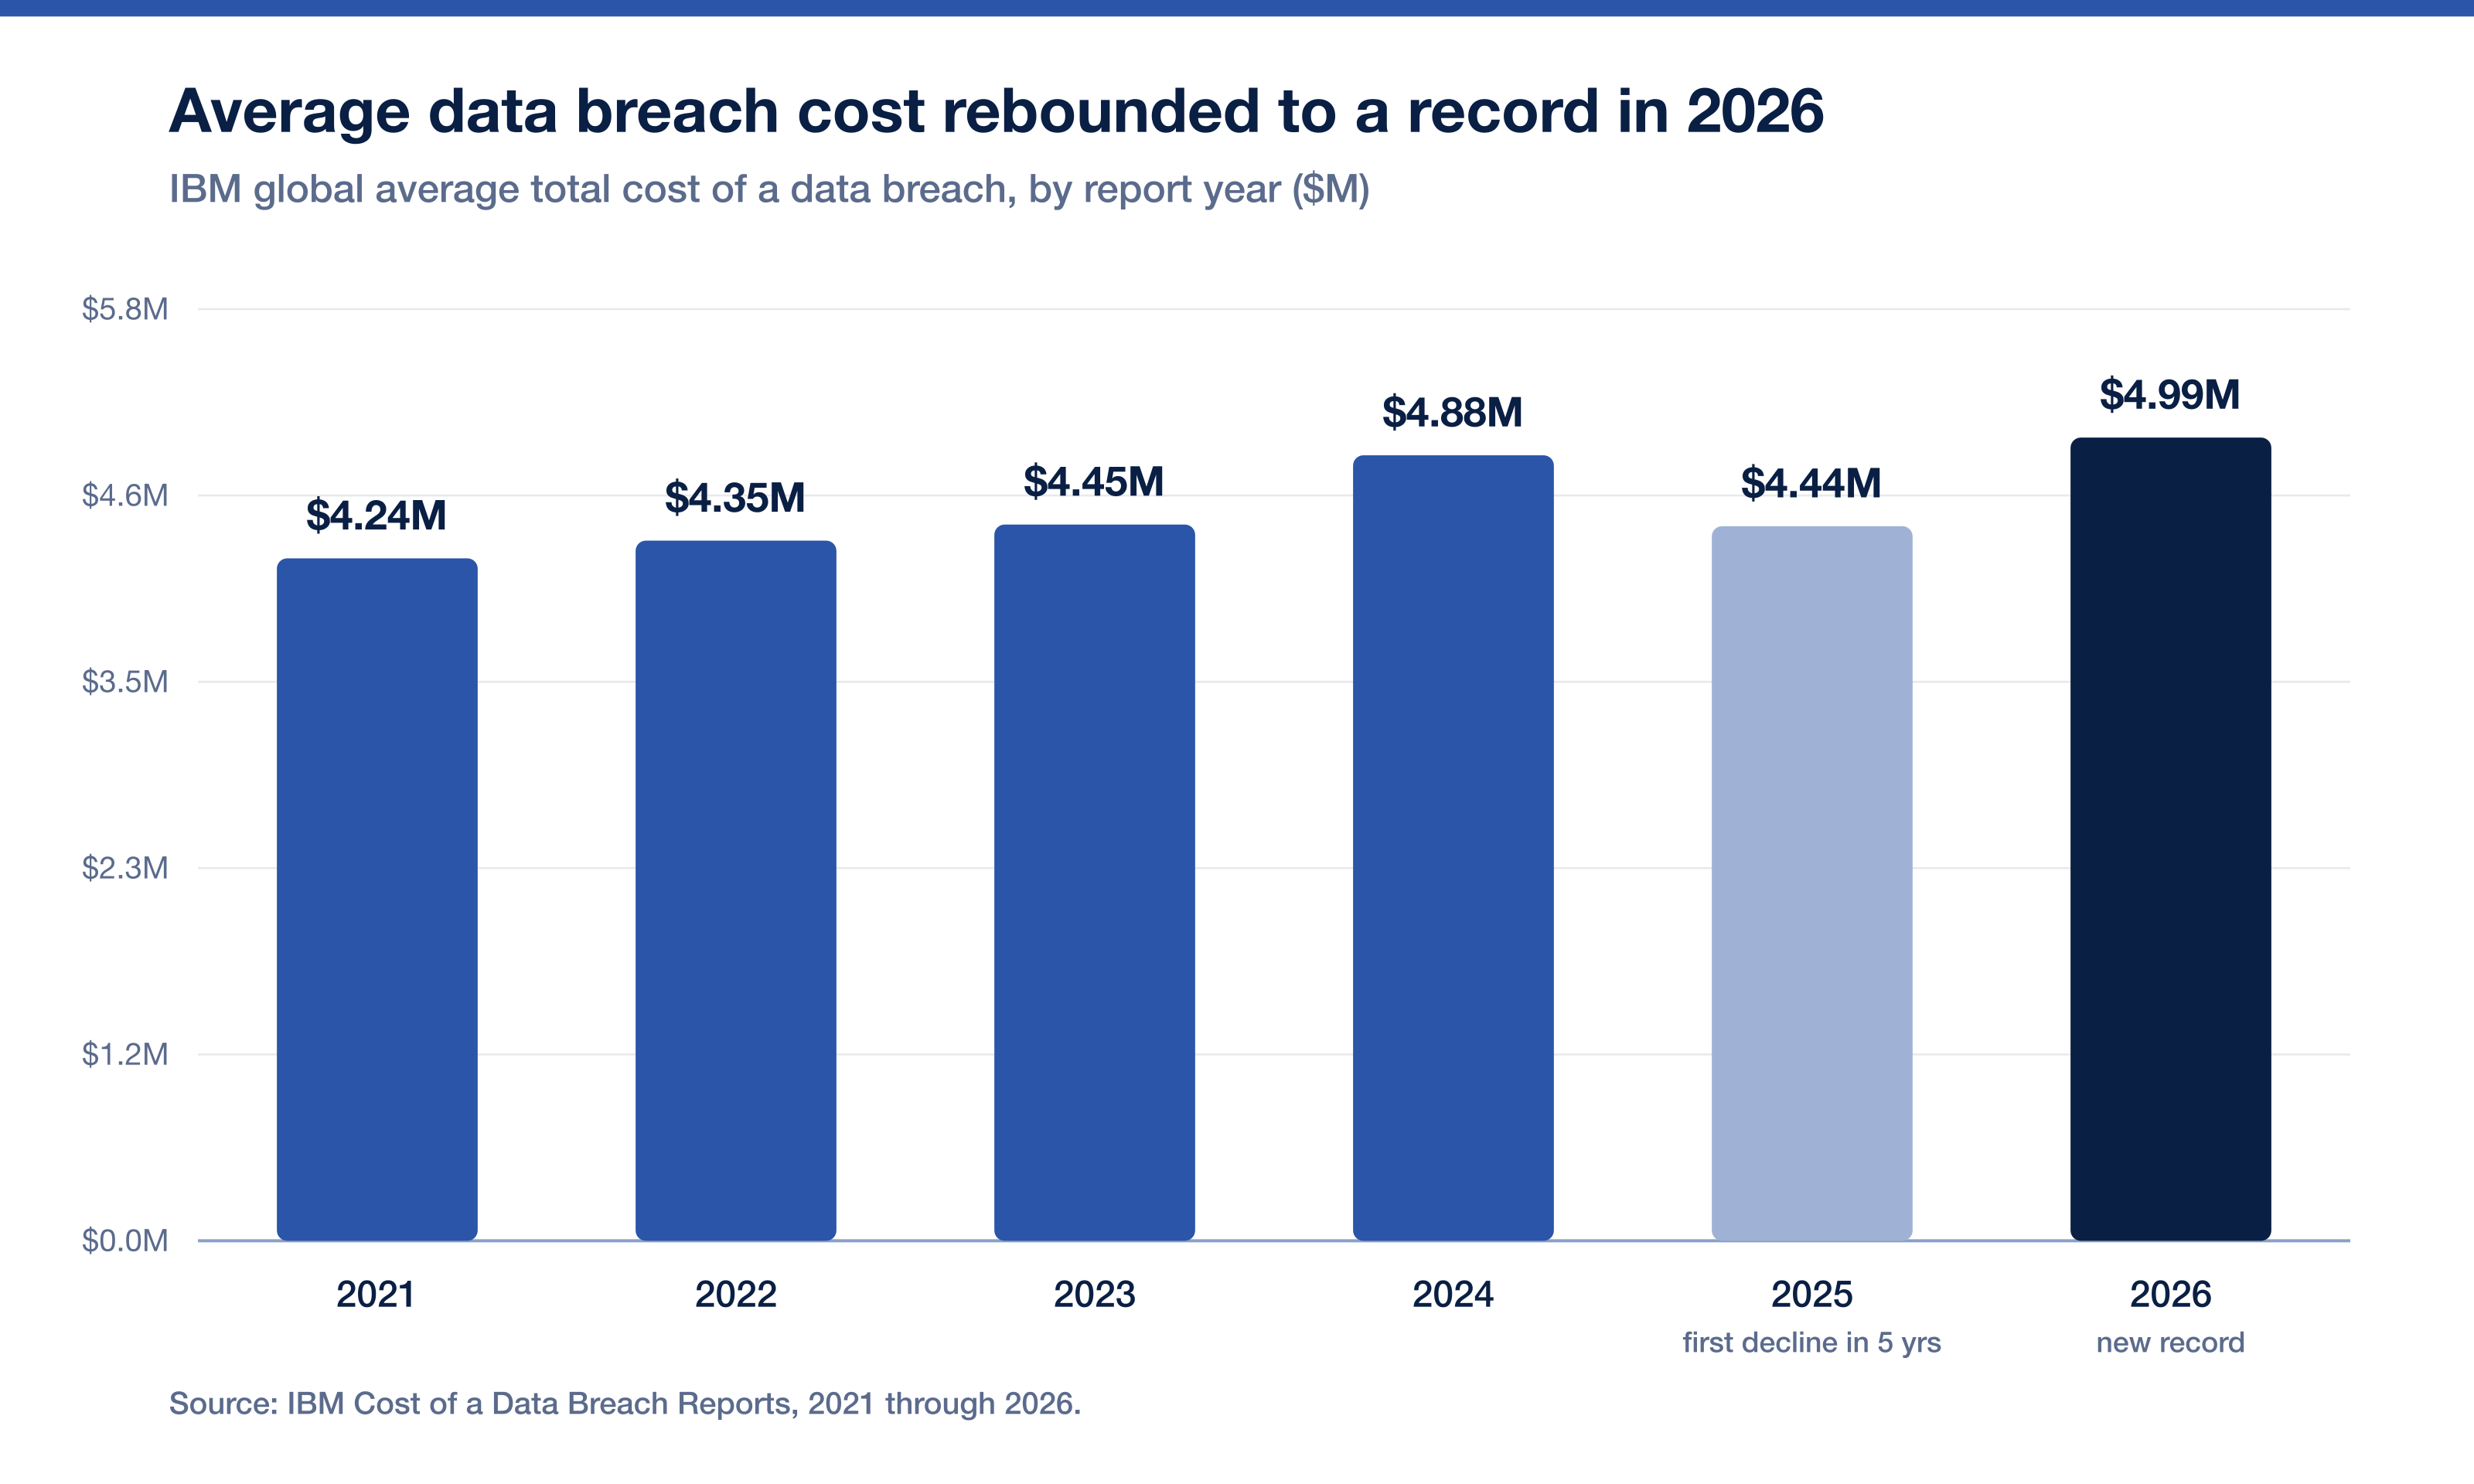
The six-year trend shows how unusual the 2025 dip was against an otherwise steady climb.
Table 1: Average total cost of a data breach, year over year
Year (IBM report) | Global average | Notable change |
|---|---|---|
2021 | US$4.24M | Baseline |
2022 | US$4.35M | +2.6% |
2023 | US$4.45M | +2.3% |
2024 | US$4.88M | +9.7% |
2025 | US$4.44M | Down 9%, first decline in 5 years |
2026 | US$4.99M | Up 12%, new record |
Source: IBM Cost of a Data Breach Reports, 2021 through 2026. US average for 2026 is US$11.5M, up from US$10.22M in 2025.
Which industry has the most expensive breaches?
Healthcare has the most expensive data breaches, at US$6.64 million per incident in 2026, its 13th consecutive year as the costliest industry (IBM, 2026). Financial services follows closely at US$6.29 million, with technology and industrial organizations both near US$5.5 million. Even after a 10.5% year-over-year decline from US$7.42 million, healthcare remains the sector where a breach hurts most, driven by regulatory exposure, the sensitivity of medical records and the operational stakes of downtime.
Table 2: Average data breach cost by industry (2026)
Industry | Average breach cost (2026) | Source |
|---|---|---|
Healthcare | US$6.64M | IBM Cost of a Data Breach 2026 |
Financial services | US$6.29M | IBM Cost of a Data Breach 2026 |
Technology | US$5.50M | IBM Cost of a Data Breach 2026 |
Industrial | US$5.50M | IBM Cost of a Data Breach 2026 |
Energy | US$5.24M | IBM Cost of a Data Breach 2026 |
Global average (all industries) | US$4.99M | IBM Cost of a Data Breach 2026 |
For a sector-specific deep dive, see our companion reference on education data breach statistics, where the cost profile and threat mix differ sharply from healthcare and finance.
What is the most common cause of data breaches?
The most common cause of data breaches in 2026 is vulnerability exploitation, which was the initial access vector in 31% of breaches (Verizon 2026 DBIR). This is the year's most important shift: exploited vulnerabilities overtook stolen credentials, which fell to 13% as an initial vector even though credentials still appear somewhere in 39% of breaches. Phishing remains the single most common entry point in IBM's dataset, where it led all vectors for a fourth consecutive year and, in its voice and SMS variants, carried the highest average cost.
The human element sits behind most incidents regardless of the technical vector: 62% of breaches involved a person through error, social engineering or misuse (Verizon, 2026). Ransomware was present in 48% of breaches, up from 44%, and third parties featured in another 48%, a 60% year-over-year jump.
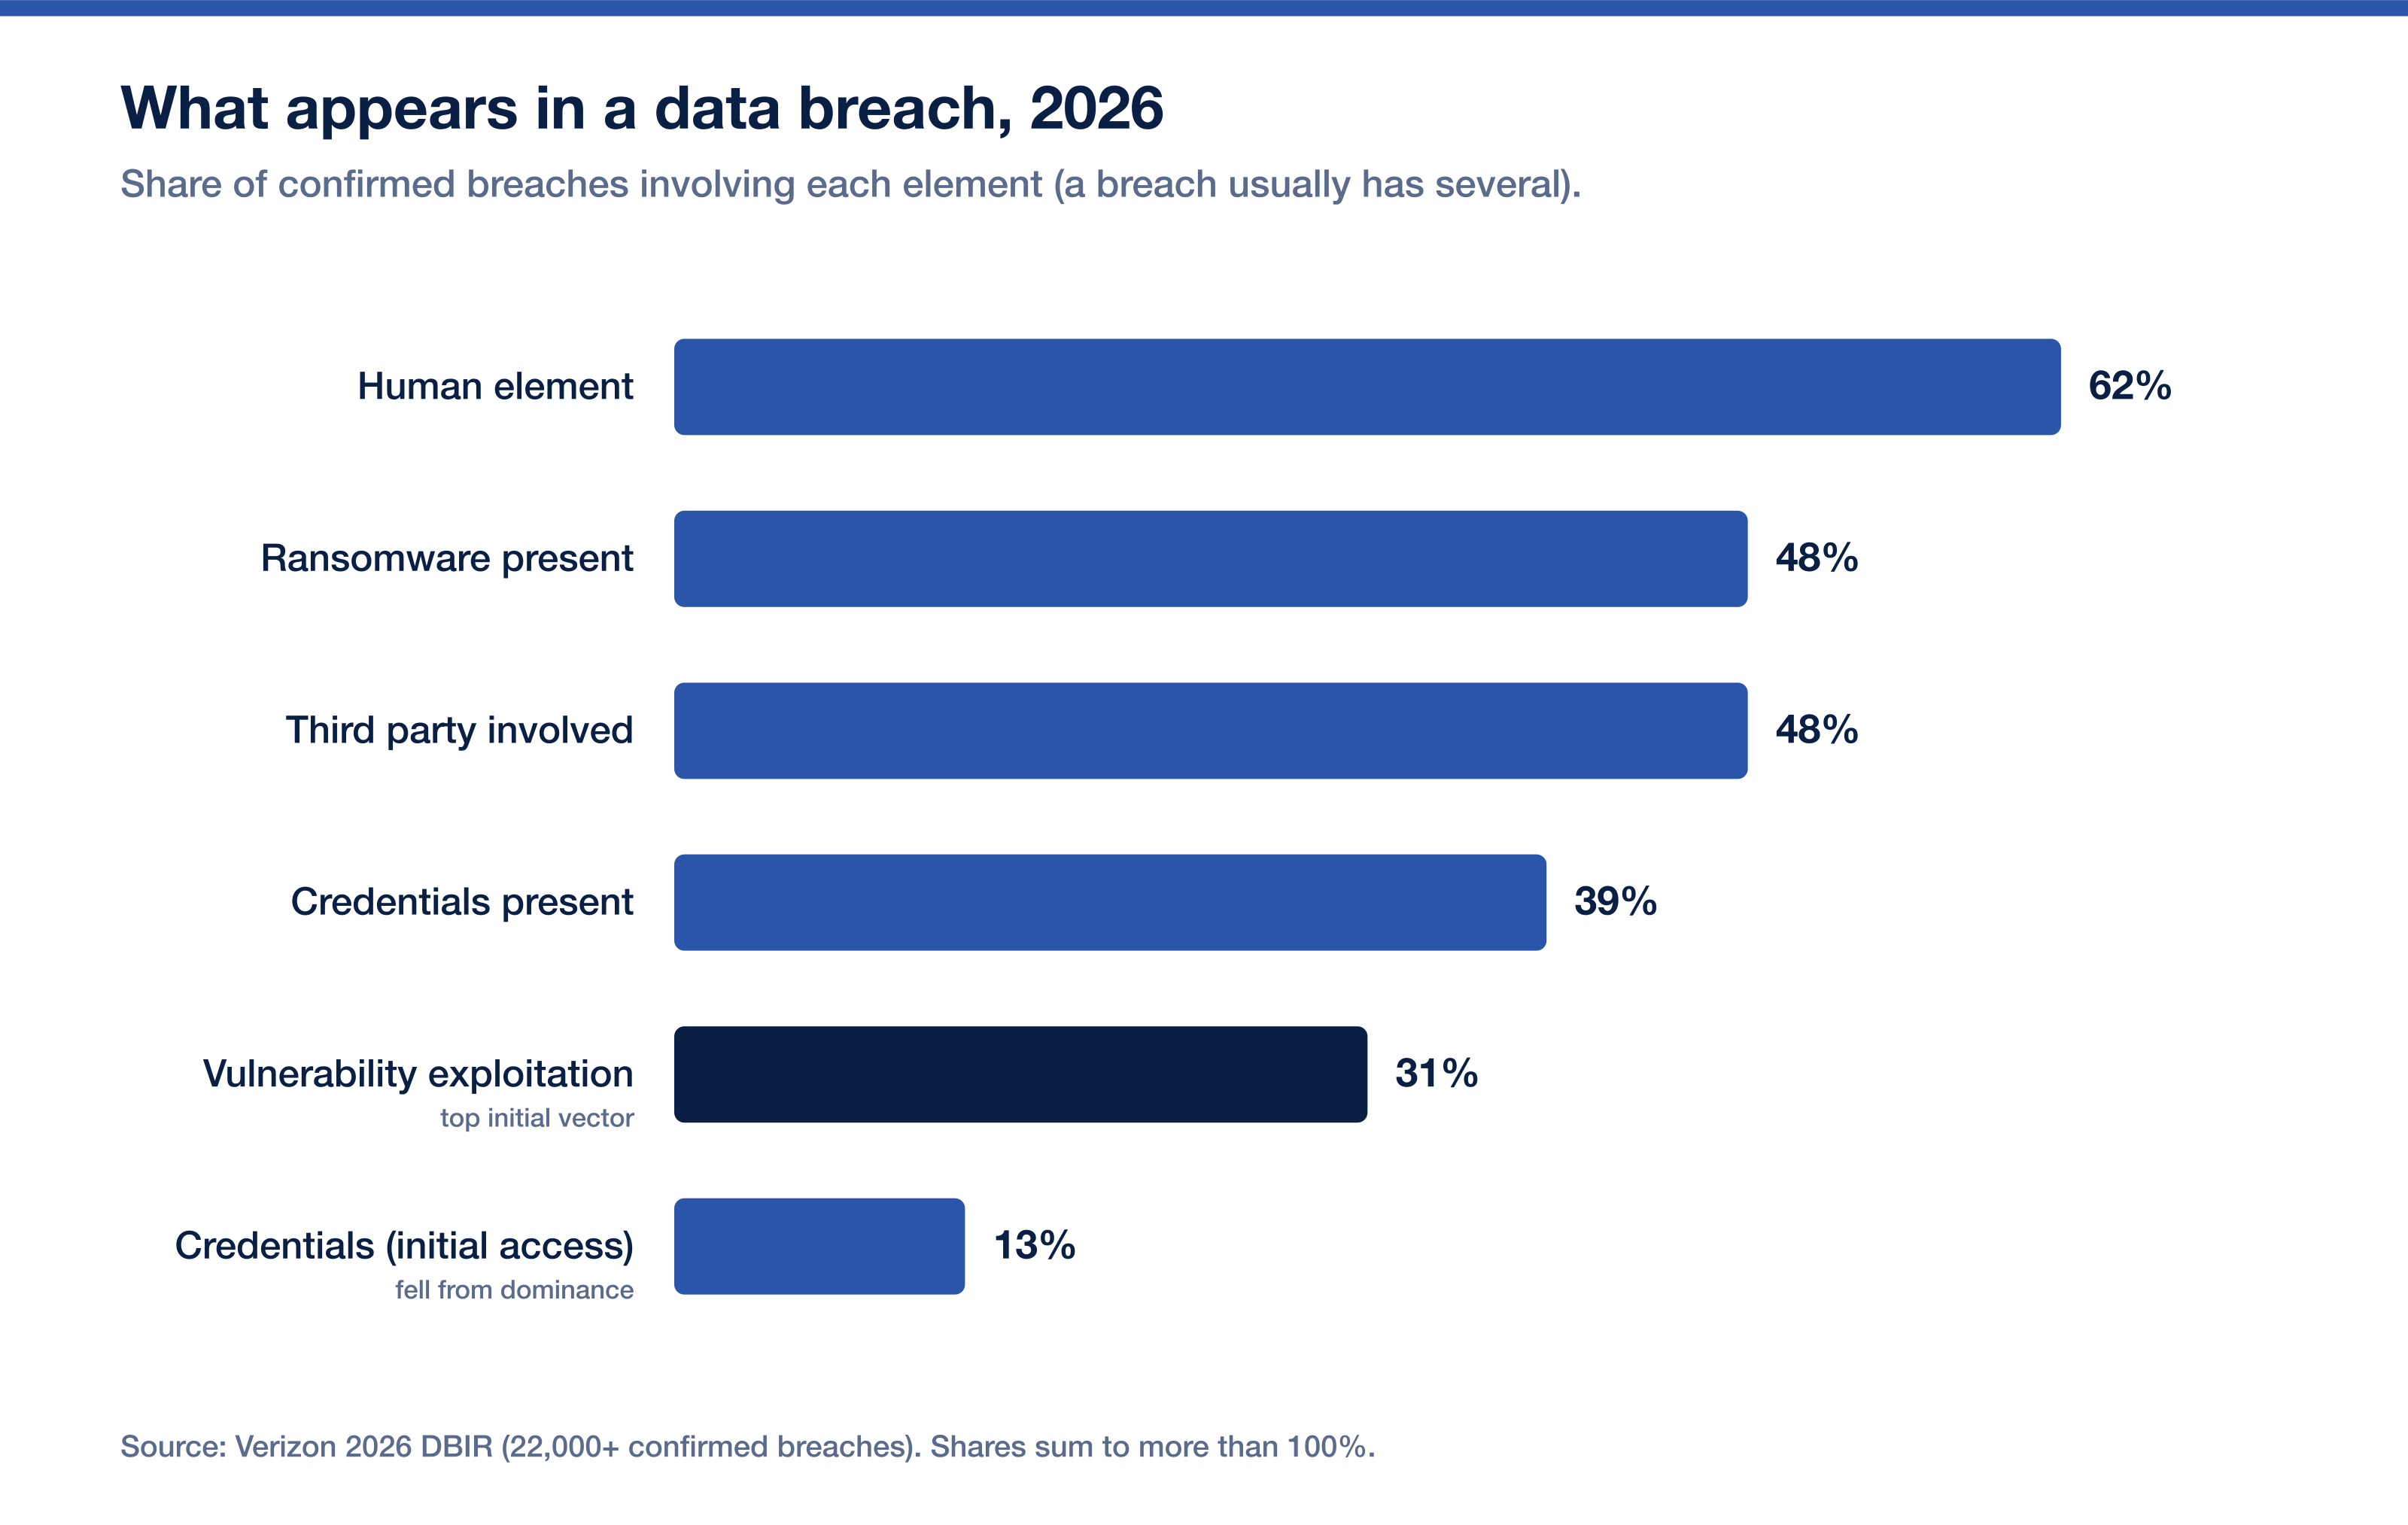
What a breach is made of
A single breach usually involves several of these elements at once, which is why the shares below sum to more than 100%. The chart reads as "what appears in a breach," not "the one cause."
Table 3: What appears in a data breach (2026 Verizon DBIR)
Element of the breach | Share of breaches | Note |
|---|---|---|
Human element (error, social engineering, misuse) | 62% | Person involved somewhere in the chain |
Ransomware present | 48% | Up from 44% the prior year |
Third party involved | 48% | 60% year-over-year increase |
Credentials present anywhere | 39% | Still a workhorse for lateral movement |
Vulnerability exploitation (initial access) | 31% | New top initial vector |
Credential abuse (initial access) | 13% | Fell from prior dominance |
Source: Verizon 2026 Data Breach Investigations Report (22,000+ confirmed breaches).
How much does each attack vector cost?
Cost and frequency are not the same thing. Phishing is the most common way in, but its voice (vishing) and SMS (smishing) variants are the most expensive at an average of US$5.29 million per breach (IBM, 2026). Social engineering such as help desk impersonation and MFA fatigue follows at US$5.23 million, then external remote services at US$5.11 million and abusing valid accounts at US$5.07 million. Supply chain compromise costs US$4.96 million as an entry point, and separately, a supply chain breach that runs through a compromised business partner is the single biggest cost amplifier IBM measured, adding US$227,250 to the average breach.
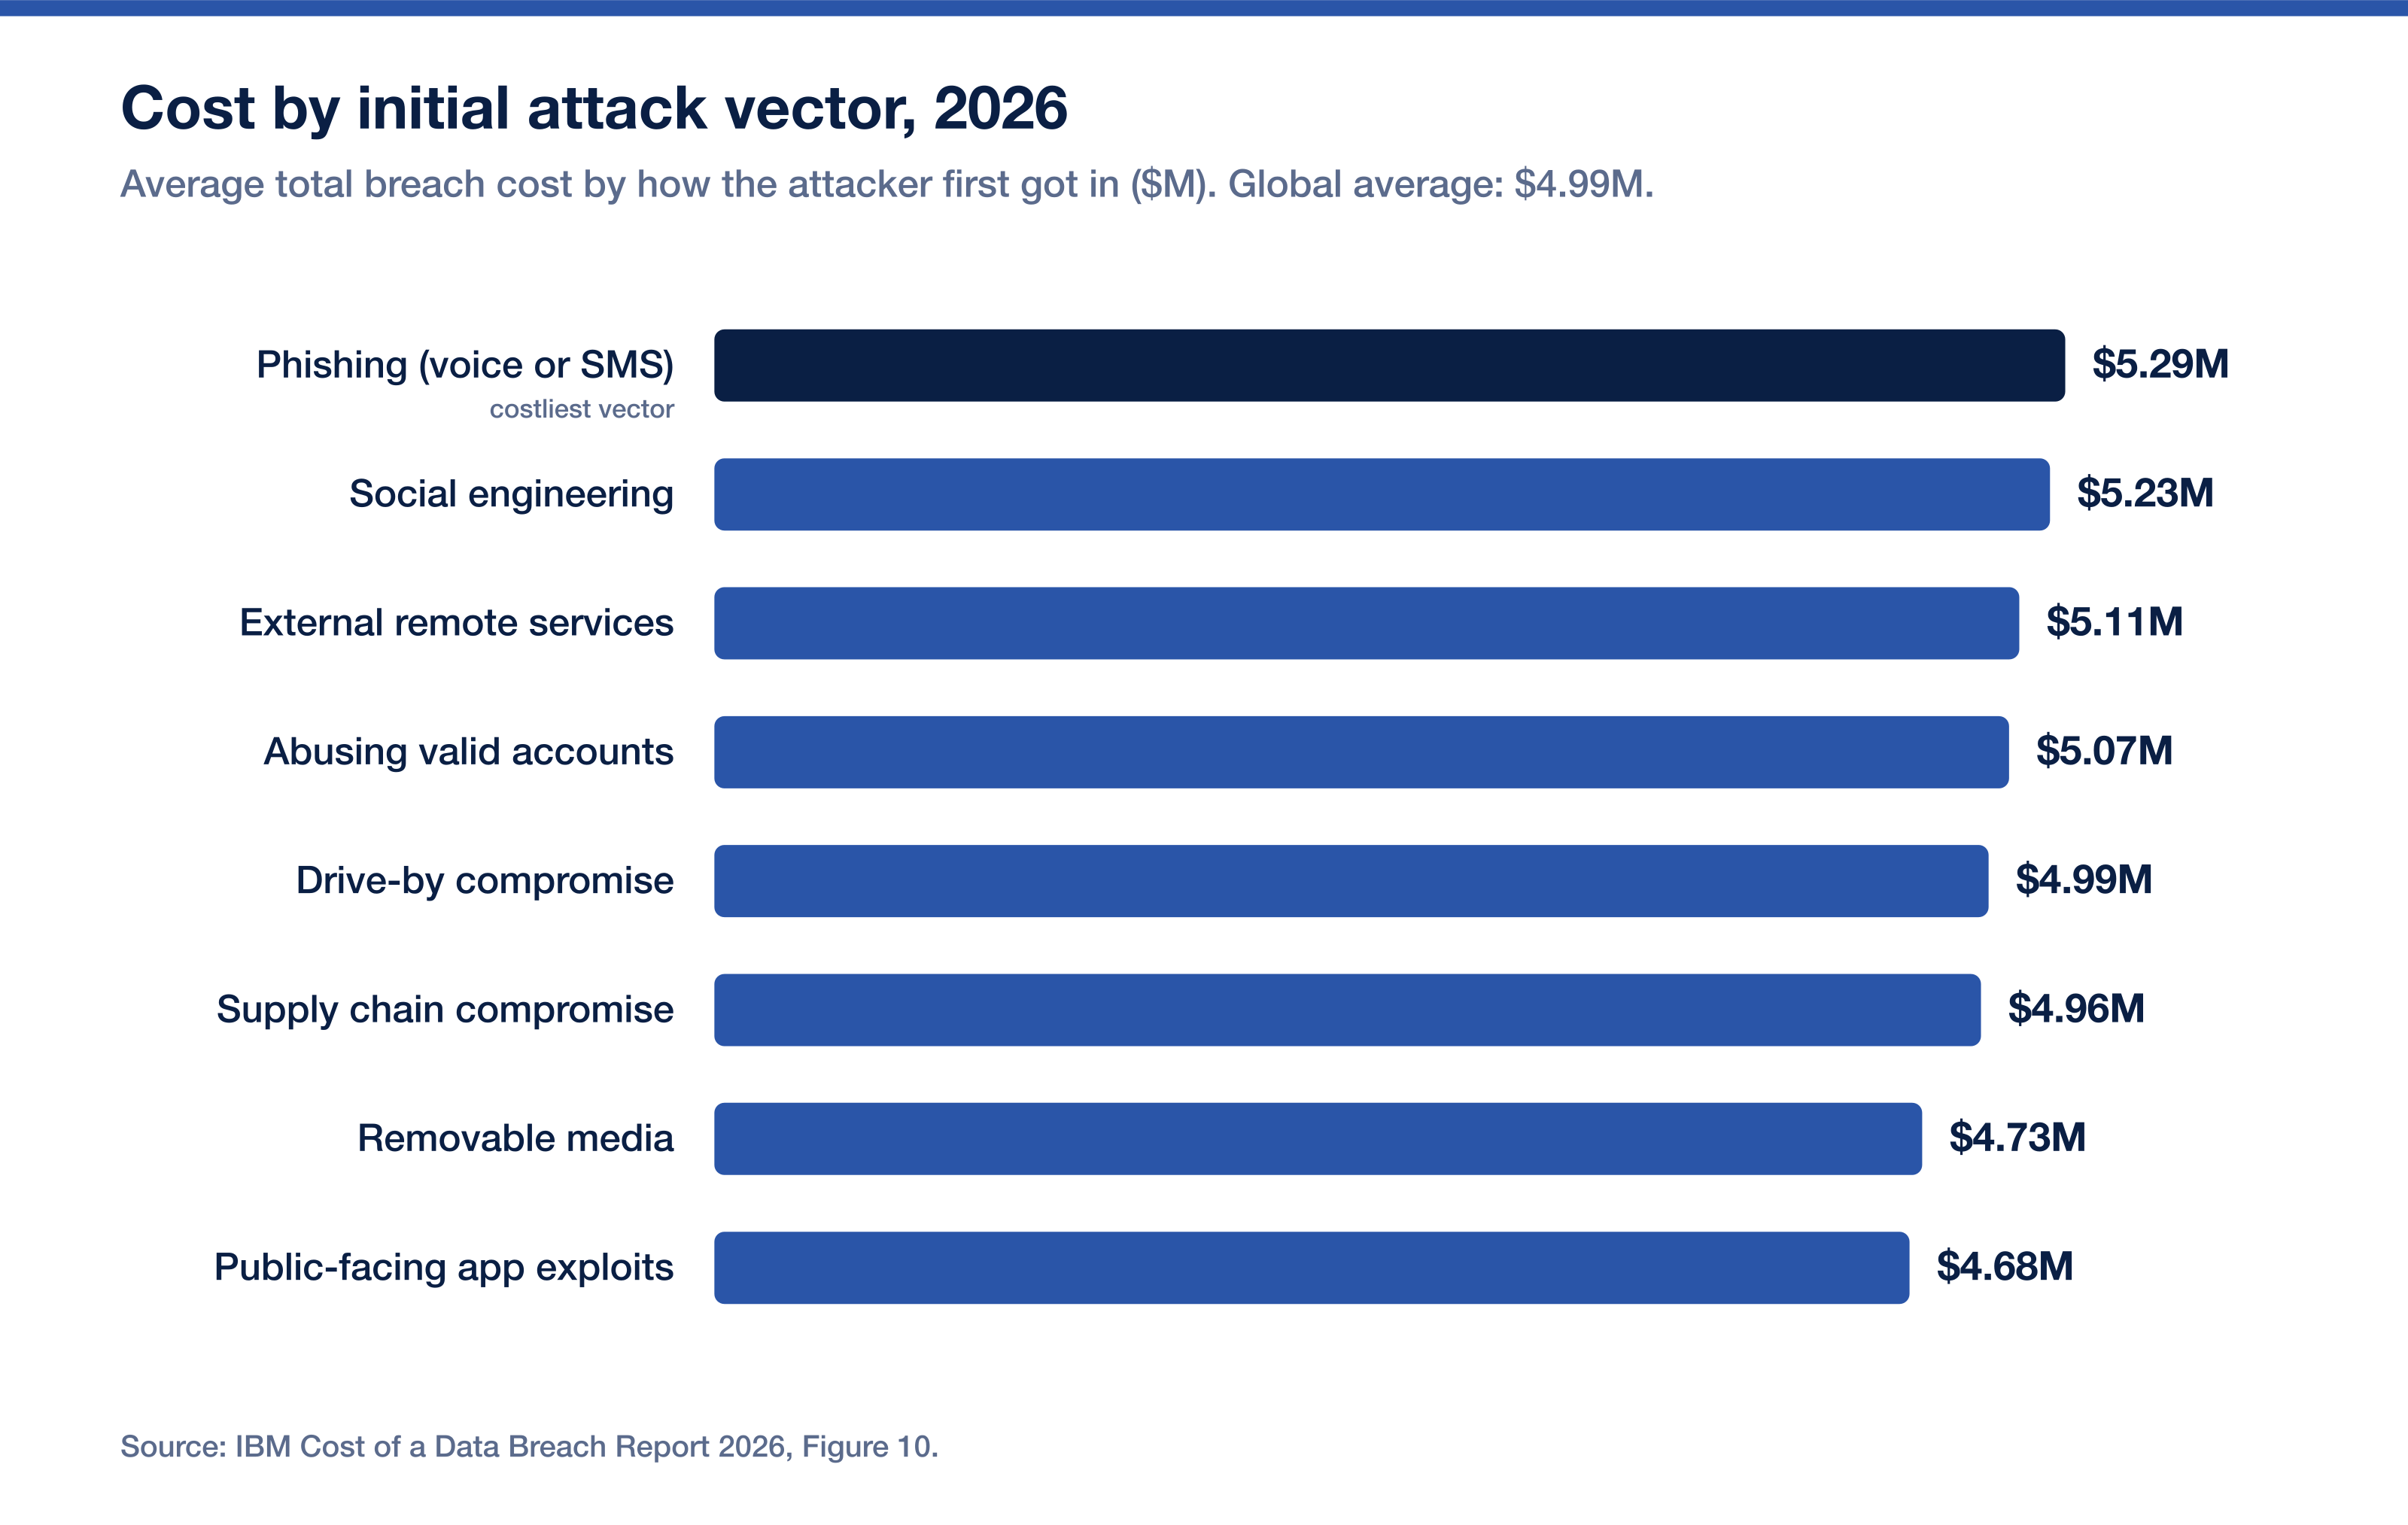
Table 4: Average breach cost by initial attack vector (2026)
Initial attack vector | Average breach cost | Source |
|---|---|---|
Phishing (voice or SMS phishing) | US$5.29M | IBM Cost of a Data Breach 2026 |
Social engineering (help desk impersonation, MFA fatigue) | US$5.23M | IBM Cost of a Data Breach 2026 |
External remote services | US$5.11M | IBM Cost of a Data Breach 2026 |
Abusing valid accounts | US$5.07M | IBM Cost of a Data Breach 2026 |
Drive-by compromise | US$4.99M | IBM Cost of a Data Breach 2026 |
Supply chain compromise | US$4.96M | IBM Cost of a Data Breach 2026 |
Replication through removable media | US$4.73M | IBM Cost of a Data Breach 2026 |
Exploiting public-facing applications | US$4.68M | IBM Cost of a Data Breach 2026 |
Global average (all vectors) | US$4.99M | IBM Cost of a Data Breach 2026 |
Mandiant's frontline data adds a different angle on causes. Exploits were the top initial infection vector for the sixth consecutive year at 32% of intrusions, with prior compromise rising to 30% for ransomware-specific cases (Mandiant M-Trends 2026). The through-line across all three publishers is consistent: exposed, unpatched and internet-facing assets are the defining exposure of 2026.
How long does it take to detect a breach?
A data breach takes an average of 247 days to identify and contain across its full lifecycle in 2026, up 2.5% from 241 days in 2025 (IBM Cost of a Data Breach 2026). That is more than eight months from the moment an attacker gets in to the moment the incident is fully closed out. The longer a breach runs, the more it costs: incidents that take more than 200 days to resolve are consistently the most expensive.
Mandiant's incident-response data tells a tighter but still uncomfortable story. Global median dwell time was 14 days in 2025, up from 11 the year before (Mandiant M-Trends 2026). Encouragingly, organizations detected 52% of intrusions themselves, up from 43%, meaning internal security teams are catching more than half of incidents before an outside party has to tell them. The catch is speed on the other side: the median time from initial access to handing off that access to another actor collapsed to 22 seconds in 2025, from more than eight hours in 2022.
Table 5: Detection and containment timeline (2025 to 2026)
Metric | Figure | Source |
|---|---|---|
Mean time to identify and contain a breach | 247 days | IBM Cost of a Data Breach 2026 |
Median attacker dwell time | 14 days | Mandiant M-Trends 2026 |
Breaches detected internally | 52% | Mandiant M-Trends 2026 |
Median time to fully remediate a vulnerability | 43 days | Verizon 2026 DBIR |
Known-exploited vulnerabilities fully remediated | 26% | Verizon 2026 DBIR |
Median attacker time from access to hand-off | 22 seconds | Mandiant M-Trends 2026 |
The remediation numbers are the quiet alarm here. The median time to fully patch a vulnerability rose to 43 days, from 32, and only 26% of known-exploited vulnerabilities were fully remediated during the DBIR window, down from 38% (Verizon, 2026). With vulnerability exploitation now the top initial vector, a widening patch gap is exactly the wrong trend.
How many data breaches happen per year?
There is no single authoritative global count of data breaches, because no one body observes them all. The most-cited proxies come from three publishers measuring three different populations, and the honest answer is to read them side by side.
The Verizon DBIR analyzed more than 22,000 confirmed breaches in its 2026 dataset, its largest ever, spanning 145 countries (Verizon, 2026). That is a caseload, not a census: it reflects the incidents Verizon and its partners investigated, not every breach on earth.
For the United States, the FBI IC3 logged 1,008,597 complaints in 2025, the first year it crossed one million, with reported losses of US$20.877 billion, a 26% increase (FBI IC3, 2025). Within the IC3's cyber-threat complaints, data breach was the single largest category at 39%, ahead of ransomware at 36%. Those are self-reported public complaints, so they undercount incidents that victims never report.
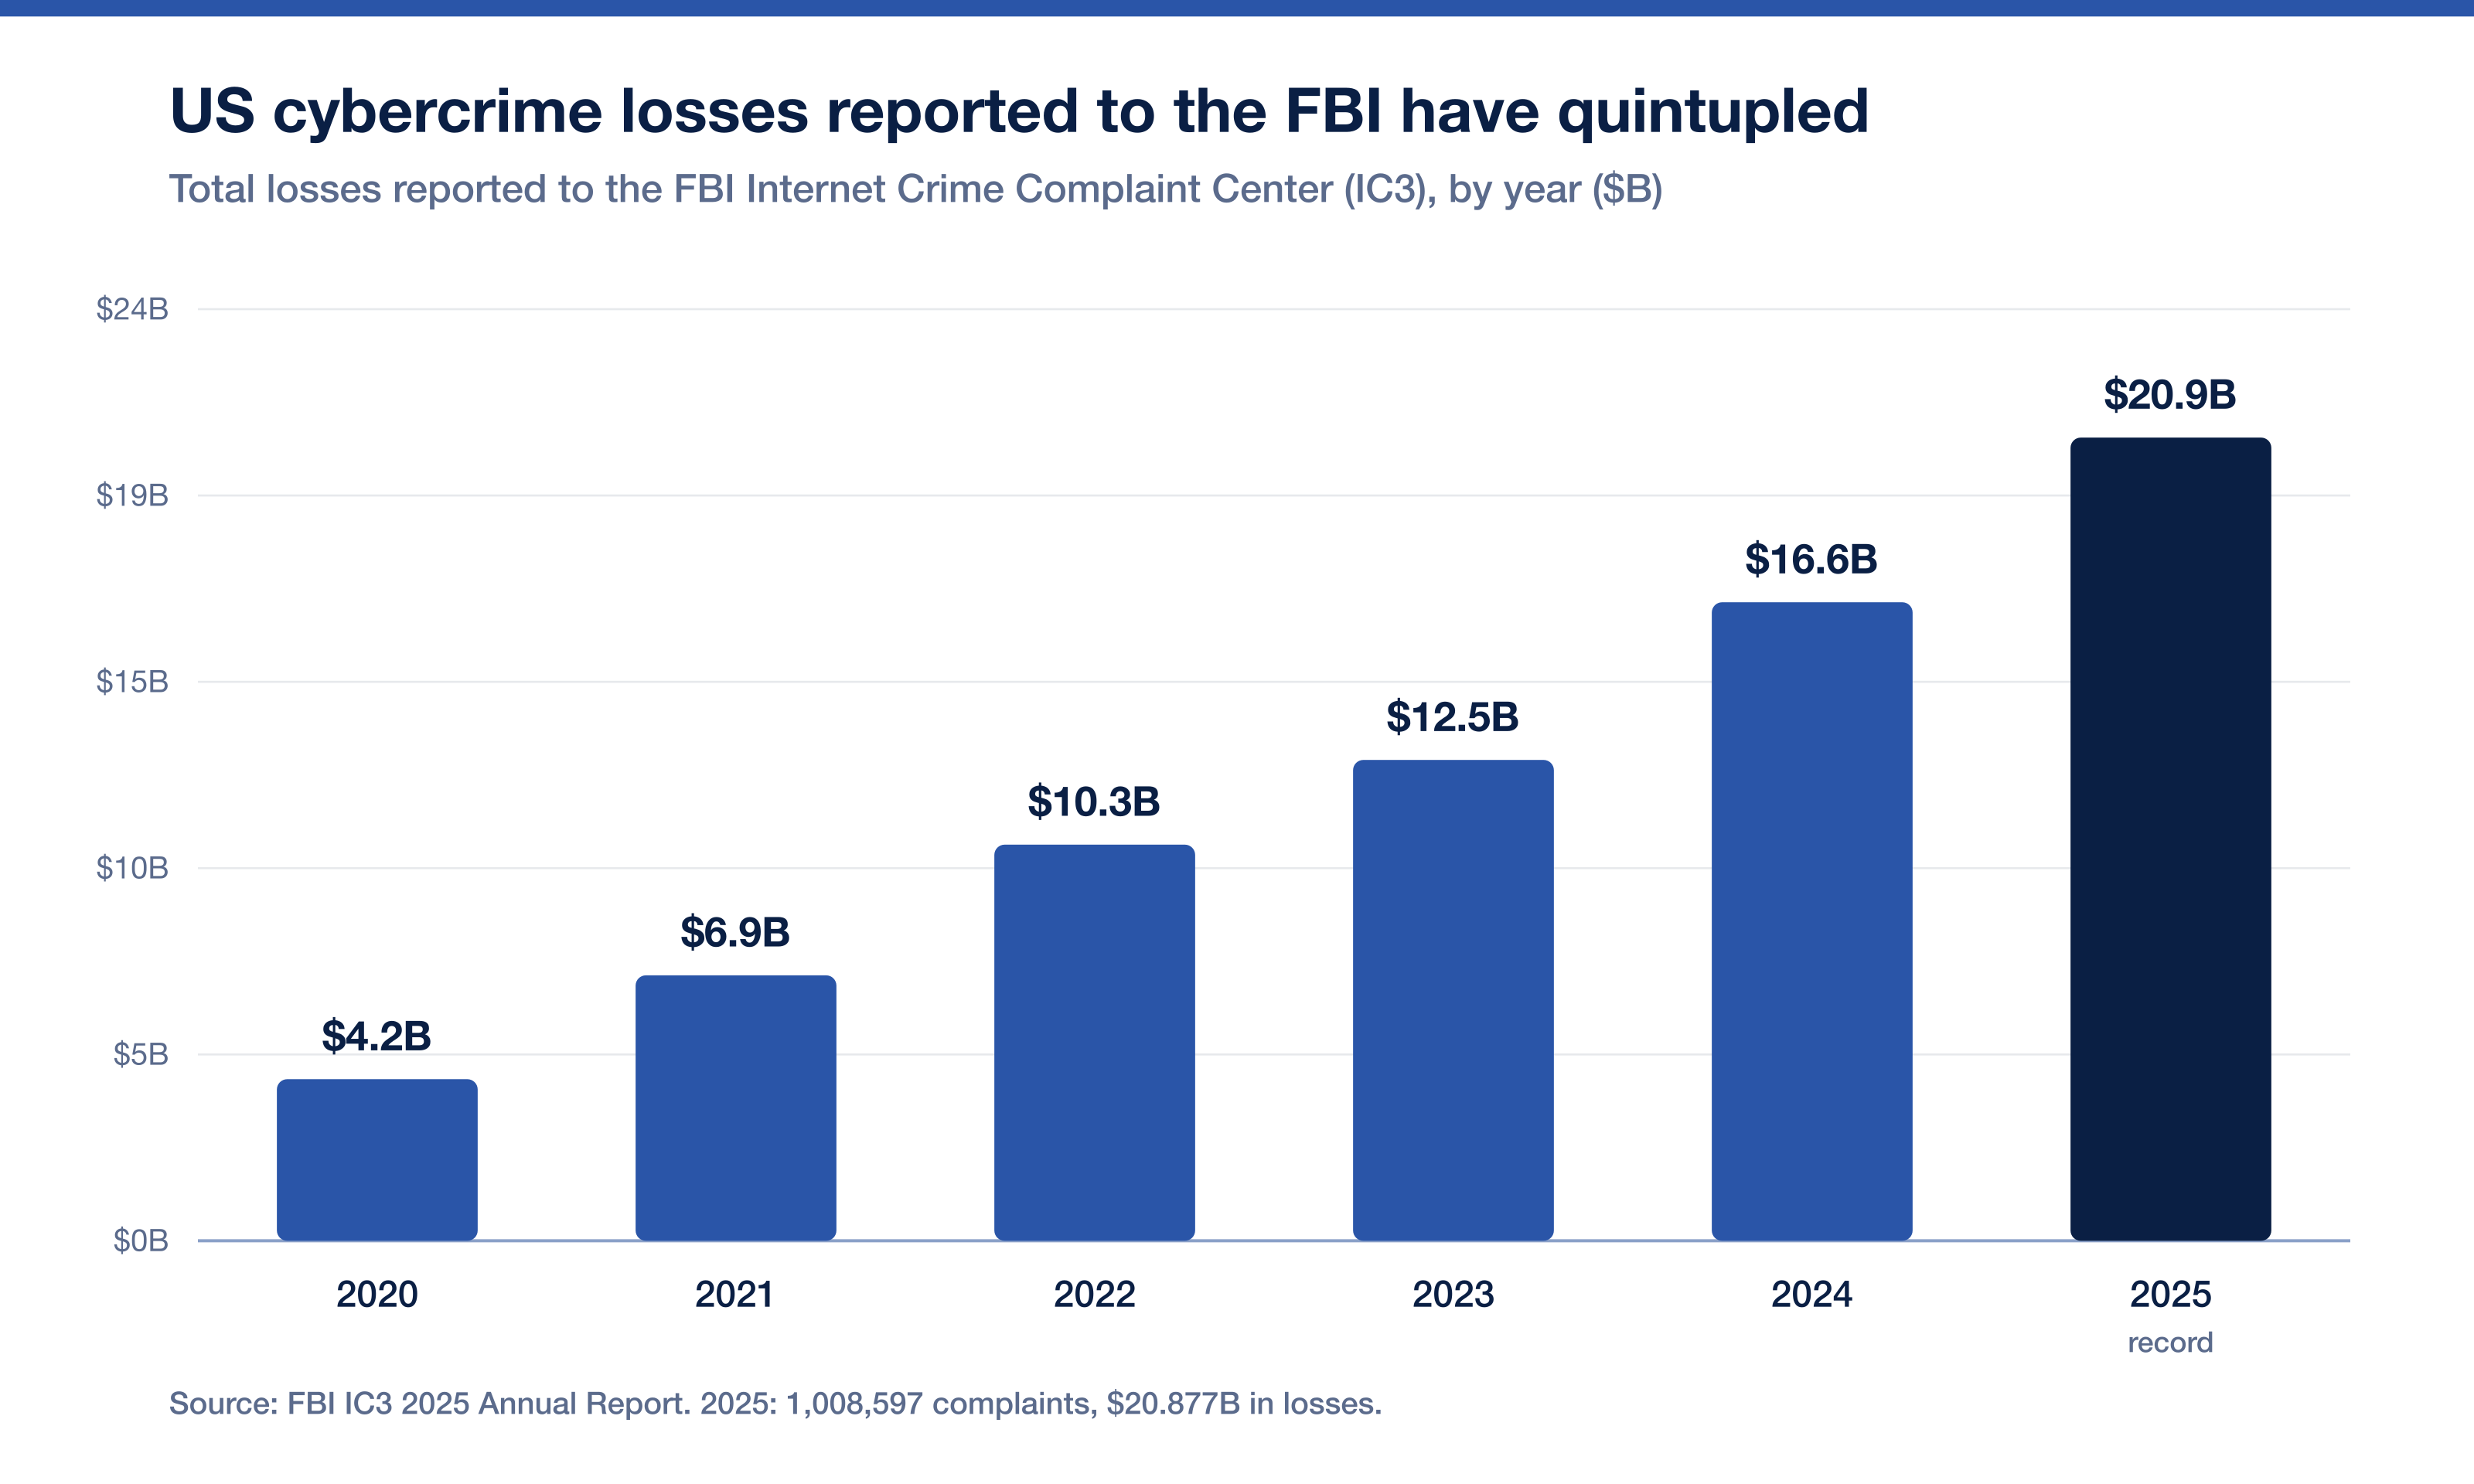
The IC3's six-year loss curve is the clearest single picture of how fast reported cybercrime is scaling.
Table 6: Cybercrime complaints and losses reported to the FBI IC3
Year | Reported losses | Complaints |
|---|---|---|
2020 | US$4.2B | 791,790 |
2021 | US$6.9B | Rising |
2022 | US$10.3B | Rising |
2023 | US$12.5B | Rising |
2024 | US$16.6B | Rising |
2025 | US$20.877B | 1,008,597 |
Source: FBI IC3 2025 Annual Report. Complaint counts shown where the report states an exact figure.
For the broader landscape beyond breach-specific numbers, our state of cybersecurity statistics reference collects attack-frequency and industry-targeting data, and our ransomware payout statistics page goes deep on the extortion economy specifically.
The AI dimension: the fastest-moving line on the invoice
Artificial intelligence stopped being a hypothetical breach factor in 2026 and became a measurable one. One in four malicious breaches was AI-enabled, a 56% year-over-year increase, and those breaches cost an average of US$6 million, roughly US$1 million above the overall average (IBM Cost of a Data Breach 2026). Critical-infrastructure organizations absorbed 62% of AI-driven attacks.
The bigger governance story is internal. Unapproved shadow AI tools figured in 43% of security incidents, and close to seven in ten breached organizations had no AI governance policy at all (IBM, 2026). More than 20% of organizations reported a breach that targeted their own AI models or applications, most often through compromised APIs and plug-ins (27%) or cloud misconfigurations affecting AI workloads (27%). The DBIR corroborates the exposure from the workforce side: 45% of employees now use AI on corporate devices, up from 15%, and 67% do so through non-corporate accounts (Verizon, 2026).
There is a defensive mirror image. Organizations that deployed AI and automation across prevention, detection, investigation and response closed breaches roughly two months faster and paid close to US$2 million less per breach (IBM, 2026). AI is cutting both ways in 2026, and the gap between organizations that govern it and those that do not is now visible in the cost data.
Business email compromise and financial losses
Business email compromise remains one of the most financially damaging categories in the data. BEC drove US$3.046 billion in reported losses in 2025, the second-largest loss category behind investment fraud's US$8.649 billion (FBI IC3, 2025). Ransomware, by contrast, showed only US$32 million in directly reported IC3 losses across more than 3,600 complaints, a figure the FBI explicitly flags as a severe undercount because it excludes downtime, lost business and third-party remediation, and because many victims report no dollar amount at all.
That undercount is the reason breach-cost readers should anchor on IBM's ransomware-inclusive breach economics and Verizon's 48% ransomware-presence figure rather than the IC3's narrow direct-loss line. Each publisher is measuring a different slice of the same problem.
What this means for your security program
The 2026 data points every buyer toward the same short list of priorities. None of them are novel, and that is exactly the point: the fundamentals still decide outcomes.
Close the patch gap first. Vulnerability exploitation is now the top initial access vector at 31% (Verizon, 2026), yet median remediation slipped to 43 days and only 26% of known-exploited vulnerabilities were fully fixed. Prioritize internet-facing and known-exploited issues on aggressive service-level targets.
Test the way attackers actually get in. With phishing the costliest common vector and exploited vulnerabilities the most frequent, regular penetration testing and continuous validation surface the exposures that scanners miss, before they become a 247-day incident.
Extend diligence to third parties. Supply chain and third-party involvement now touch 48% of breaches. Contractually require testing evidence and monitor the vendors that hold your data.
Govern AI before it governs your risk. Shadow AI touched 43% of incidents and most breached organizations had no AI policy. Inventory AI use, control access, and test AI-facing applications directly.
Compress dwell time. Internal detection is improving, but a 14-day median dwell time and 22-second access hand-offs mean detection and response speed is where breach cost is won or lost.
Stingrai's role here is narrow and practical: we run offensive security engagements, from annual and one-time penetration tests to continuous testing programs, that pressure-test these exact exposures, with certified human pentesters working alongside Snipe, our AI agent for web application penetration testing that hunts complex flaws like broken access control and business-logic bugs. That evidence also supports your SOC 2, ISO 27001 and PCI DSS compliance programs. If you are sizing a program, our penetration testing cost guide and pricing page lay out the ranges, or you can request a quote directly.
Frequently asked questions
How much does a data breach cost in 2026?
The average data breach costs US$4.99 million globally and US$11.5 million in the United States in 2026, according to the IBM Cost of a Data Breach Report 2026. The global figure is a record and a 12% increase year over year. Costs vary widely by industry and geography, with healthcare (US$6.64M) and the US market carrying the highest averages.
What is the most common cause of data breaches?
Vulnerability exploitation is the most common initial cause, accounting for 31% of breaches in the Verizon 2026 DBIR, having overtaken stolen credentials, which fell to 13% as an initial vector. Phishing remains the single most common entry point in IBM's dataset. The human element, through error, social engineering or misuse, is involved in 62% of breaches overall.
How long does it take to detect a breach?
A breach takes an average of 247 days to identify and contain across its full lifecycle (IBM, 2026). Mandiant's incident responders measured a median attacker dwell time of 14 days in 2025 (Mandiant M-Trends 2026), with 52% of intrusions detected internally rather than by an outside party.
Which industry has the most expensive breaches?
Healthcare has the most expensive data breaches, at US$6.64 million per incident in 2026, its 13th consecutive year as the costliest industry (IBM, 2026). Financial services is second at US$6.29 million, followed by technology and industrial organizations at roughly US$5.5 million each.
How many data breaches happen per year?
There is no single global census. The Verizon 2026 DBIR analyzed more than 22,000 confirmed breaches in its caseload, and the FBI IC3 logged 1,008,597 US complaints in 2025 reporting US$20.877 billion in losses. Each measures a different population, so they are best read as complementary rather than as one number.
How much are US cybercrime losses in 2025?
US victims reported US$20.877 billion in losses across 1,008,597 complaints to the FBI IC3 in 2025, a 26% increase over 2024's US$16.6 billion (FBI IC3, 2025). Investment fraud (US$8.649B) and business email compromise (US$3.046B) were the two largest loss categories.
How many breaches involve ransomware in 2026?
Ransomware was present in 48% of breaches in the Verizon 2026 DBIR, up from 44% the prior year. The median ransom paid was US$139,875, and 69% of ransomware victims did not pay. For the full extortion picture, see our ransomware payout statistics 2026 reference.
What percentage of breaches are AI-related in 2026?
One in four (25%) malicious breaches was AI-enabled in 2026, a 56% year-over-year increase, and those breaches cost about US$1 million more than average (IBM, 2026). Separately, unapproved shadow AI tools were a factor in 43% of security incidents.
Where can I get the latest data breach statistics?
The primary sources are the IBM Cost of a Data Breach Report (cost data), the Verizon DBIR (causes and patterns), the FBI IC3 Annual Report (US losses) and Mandiant M-Trends (dwell time and detection). This page consolidates the current figures from all four and is refreshed as new editions publish.
References
IBM (with Ponemon Institute). Cost of a Data Breach Report 2026. July 2026. https://www.ibm.com/reports/data-breach. Study of 602 organizations breached between March 2025 and February 2026; source for average cost (global US$4.99M, US US$11.5M), cost by industry and attack vector, the 247-day breach lifecycle, and AI-related breach economics.
Verizon. 2026 Data Breach Investigations Report (DBIR). May 2026. https://www.verizon.com/business/resources/reports/dbir/. Analysis of 31,000+ incidents and 22,000+ confirmed breaches across 145 countries; source for breach causes, vector shares, ransomware presence (48%), human element (62%) and third-party involvement (48%).
Federal Bureau of Investigation, Internet Crime Complaint Center (IC3). 2025 Internet Crime Report. 2026. https://www.ic3.gov/AnnualReport/Reports/2025_IC3Report.pdf. Aggregation of 1,008,597 US complaints; source for reported losses (US$20.877B), BEC losses (US$3.046B) and ransomware complaint data.
Mandiant (Google Cloud). M-Trends 2026. Spring 2026. https://cloud.google.com/blog/topics/threat-intelligence/m-trends-2026/. Based on 500,000+ hours of frontline incident response in 2025; source for median dwell time (14 days), detection source (52% internal) and initial infection vectors.
Stingrai. The State of Cybersecurity: Key Statistics and Trends. https://www.stingrai.io/blog/the-state-of-cybersecurity-key-statistics-and-trends. Companion reference on broader attack frequency and industry targeting.
Stingrai. Ransomware Payout Statistics 2026. https://www.stingrai.io/blog/ransomware-payout-statistics-2026. Companion reference on ransom amounts, payment rates and threat groups.
Every figure on this page links back to its primary publisher so any claim can be audited at the source.
Ready to test your organization against the exposures behind these numbers? Talk to Stingrai about a penetration test or continuous testing program.