The malware threat surface in 2026 is a paradox. AV-TEST has indexed more than 1.56 billion unique malware samples and registers another 450,000 to 560,000 new ones every single day. Yet CrowdStrike's 2025 Global Threat Report found 79% of attack detections in 2024 involved no malware at all, climbing to 81% of interactive intrusions in the first half of 2025. Adversaries are signing in with stolen credentials, abusing valid sessions, and living off the land while vendor labs collect record sample counts.
Three forces drive 2026 malware activity. A record 7,874 ransomware victims tracked in 2025 (+50% year over year), per NCC Group. 1.95 billion stolen credentials indexed from infostealer logs in 2025, with 276 million carrying live session cookies that defeat MFA on import, per Recorded Future. And the first publicly disclosed state-sponsored AI-orchestrated cyber-espionage campaign, in which a Chinese-aligned group used Claude Code to execute 80% to 90% of tactical operations against roughly 30 global targets, per Anthropic, November 2025. The headline numbers for CISOs, security buyers, and journalists are below.
This post is the Stingrai research team's canonical 2026 reference for malware activity. It assembles 110+ numeric claims from 26 named primary publishers, including AV-TEST, Mandiant M-Trends, IBM X-Force, CrowdStrike, Microsoft Digital Defense, Sophos Active Adversary, ESET, SonicWall, Verizon DBIR, ENISA, Coveware, Recorded Future, NCC Group, Cisco Talos, FBI IC3, CISA KEV, abuse.ch, and Anthropic. Lead data is full-year 2025 telemetry, the freshest available; primary publishers have not yet released full-year 2026 reports as of April 2026. Every stat carries its source, year, and methodology window so any claim can be audited inline.
TL;DR: 12 labeled key stats
Cumulative malware samples in AV-TEST's database, March 2025: 1.56 billion (AV-TEST).
Daily new malware samples, 2025: 450,000 to 560,000 (AV-TEST).
Malware-free share of CrowdStrike-detected attacks, 2024: 79%, up from 40% in 2019 (CrowdStrike Global Threat Report 2025).
Malware-free share of CrowdStrike-detected interactive intrusions, H1 2025: 81% (CrowdStrike Threat Hunting Report 2025).
Average eCrime breakout time, 2024: 48 minutes; fastest recorded 51 seconds (CrowdStrike Global Threat Report 2025).
Mandiant 2024 global median dwell time: 11 days, up from 10 days in 2023 (Mandiant M-Trends 2025).
Backdoors share of Mandiant 2024 malware roles: 36% (vs 10% ransomware, 11% downloaders, 10% droppers, 9% credential stealers, 24% other) (Mandiant M-Trends 2025).
IBM X-Force 2024 top-5 infostealers (by dark-web listing volume): Lumma, RisePro, Vidar, Stealc, RedLine; top-5 group together produced more than 8 million ads (IBM X-Force Threat Intelligence Index 2025).
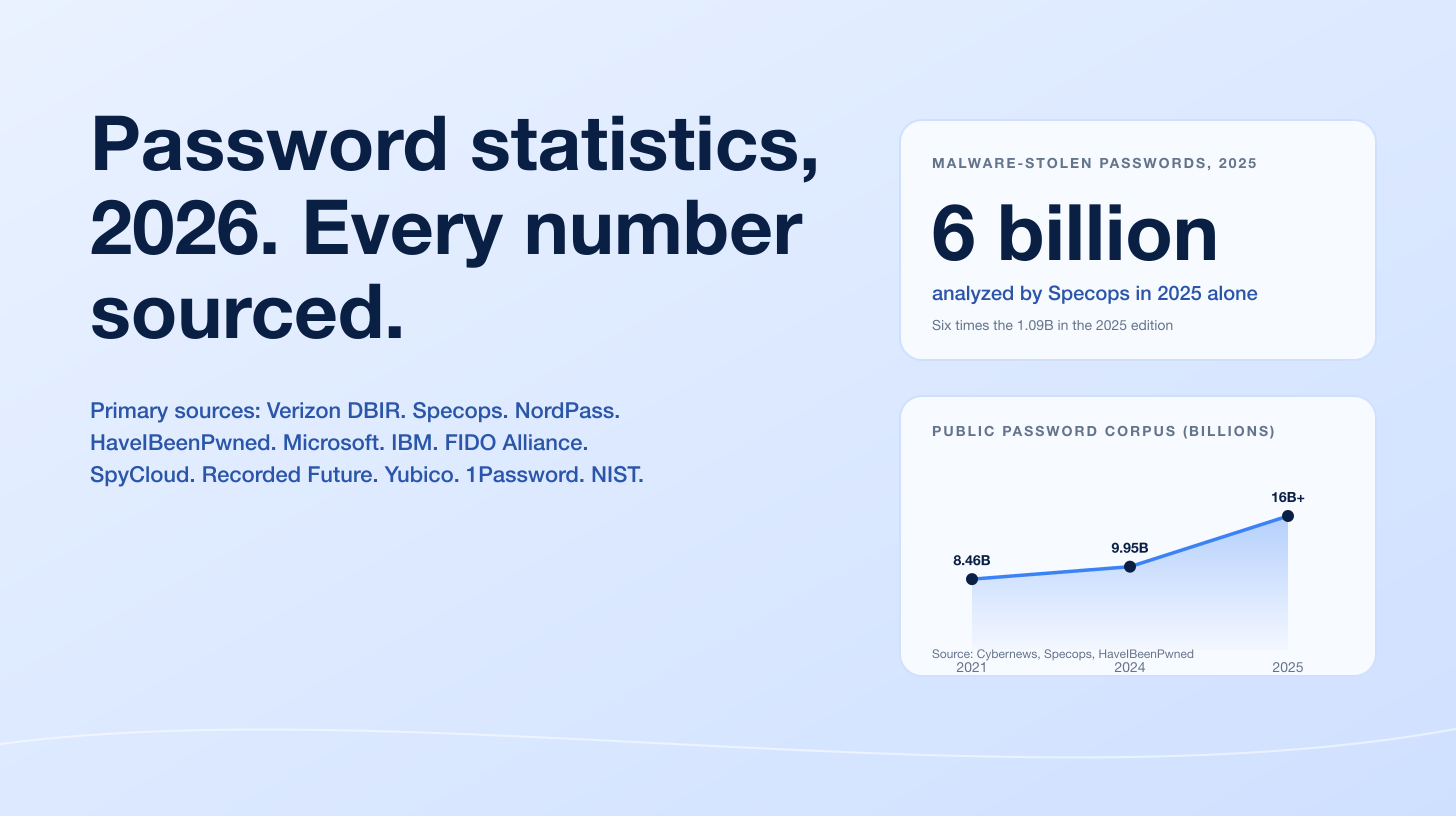
Malware-sourced credentials indexed by Recorded Future in 2025: 1.95 billion combo-list credentials, of which 276 million (31%) carried active session cookies that bypass MFA (Recorded Future Identity Threat Landscape 2025).
Ransomware presence in Verizon-reviewed breaches, 2025 DBIR: 44%, up from 32% the prior year (Verizon 2025 DBIR).
NCC Group 2025 tracked ransomware victims: 7,874, +50% YoY; Qilin (1,022 attacks, 13%) was the single most active group (NCC Group Annual Cyber Threat Intelligence 2025).
Coveware Q4 2025 ransom payment rate: 20% (historic low); median payment US$325,000 (+132% QoQ) (Coveware Q4 2025 report).
Key takeaways
The malware library is now an artifact of automation, not a count of campaigns. AV-TEST's 1.56 billion sample tally and 450,000-to-560,000 daily new-sample rate reflect packers, mutators, and AI-assisted variant generation, not 1.56 billion distinct attack campaigns. CrowdStrike's 79% malware-free intrusion rate is the more useful operational signal.
Compromised credentials are now the canonical opening move. Sophos clocked compromised credentials in 41% of IR cases (the second consecutive top-spot finish), Verizon found credential abuse in 22% of breaches, and 30% of infostealer-compromised systems were enterprise-licensed devices, per the Verizon 2025 DBIR. Recorded Future indexed 1.95 billion malware-sourced credentials in 2025 alone.
Infostealers are the load-bearing prerequisite for ransomware. The Verizon 2025 DBIR found 54% of ransomware-victim domains had appeared in infostealer logs before the attack, and 40% had corporate email addresses exposed. The chain is mostly stealer log to access broker to ransomware operator now, not phishing email to immediate ransomware.
Ransomware volume is up but ransom-payment rates have collapsed. NCC Group counted a record 7,874 ransomware victims in 2025 (+50% YoY) while Coveware's Q4 2025 payment rate fell to 20%, a level the industry has never seen. The signal: defenders are getting marginally better at restoration and refusal, but the leak-site corpus keeps growing because operators are pricing in walk-aways.
AI is now both a defender's tool and a documented attack medium. Microsoft's 2025 Digital Defense Report found 1 in 6 IBM-tracked breaches involved attackers using AI (37% for phishing, 35% for deepfakes per IBM's 2025 Cost of a Data Breach Report). Anthropic disclosed an autonomous AI-orchestrated espionage campaign in November 2025 in which a state-sponsored group used Claude Code to execute 80% to 90% of tactical operations against roughly 30 global targets.
Methodology
Sources used: AV-TEST Institute (live malware-sample counter and AV-ATLAS database, accessed April 2026); Mandiant / Google Cloud (M-Trends 2025, IR caseload calendar 2024, published April 2025); IBM X-Force (Threat Intelligence Index 2025, IR + telemetry calendar 2024, published April 2025); IBM Cost of a Data Breach Report 2025 (Ponemon survey of 600 breached organizations, March 2024 to February 2025, published August 2025); CrowdStrike (Global Threat Report 2025 published February 2025; Threat Hunting Report 2025 published August 2025); Microsoft (Digital Defense Report 2025, telemetry through H1 2025, published October 2025); Sophos (State of Ransomware 2025 published June 2025; Active Adversary Report 2025 "It takes two" published April 2025, 400+ IR / MDR cases calendar 2024); ESET (Threat Report H1 2025 published June 2025, LiveGrid telemetry Dec 2024 to May 2025); SonicWall (2025 Cyber Threat Report, Capture Labs telemetry calendar 2024, published February 2025); Verizon Business (2025 DBIR covering 22,052 incidents and 12,195 confirmed breaches Nov 2023 to Oct 2024, published April 2025); ENISA (Threat Landscape 2025, 4,875 EU incidents Jul 2024 to Jun 2025, published October 2025); Coveware (Q4 2025 quarterly ransomware report, IR caseload Q4 2025, published January 2026); Recorded Future (2025 Identity Threat Landscape Report, full-year 2025 stealer-log indexing, published March 2026); NCC Group (Annual Cyber Threat Intelligence 2025, leak-site monitoring + telemetry calendar 2025, published January 2026); Cisco Talos (2025 Year in Review and IR Trends quarterly posts, calendar 2025, published April 2026); FBI Internet Crime Complaint Center (2024 Internet Crime Report, victim complaints calendar 2024, published April 2025); CISA (Known Exploited Vulnerabilities catalog updates calendar 2025); abuse.ch URLhaus and MalwareBazaar (live community trackers); and Anthropic (Threat Intelligence Report August 2025 and "Disrupting the first reported AI-orchestrated cyber espionage campaign" published November 2025).
Date cutoff: April 25, 2026. Statistics are reported with their primary publisher's data window. We lead with full-year 2024 or 2025 figures wherever a primary source has released them. Statistics that could not be reached on at least one verification pass against a named primary source were dropped rather than estimated. Vendor blogs and aggregators that restate other publishers' numbers without adding methodology were not used as primary sources.
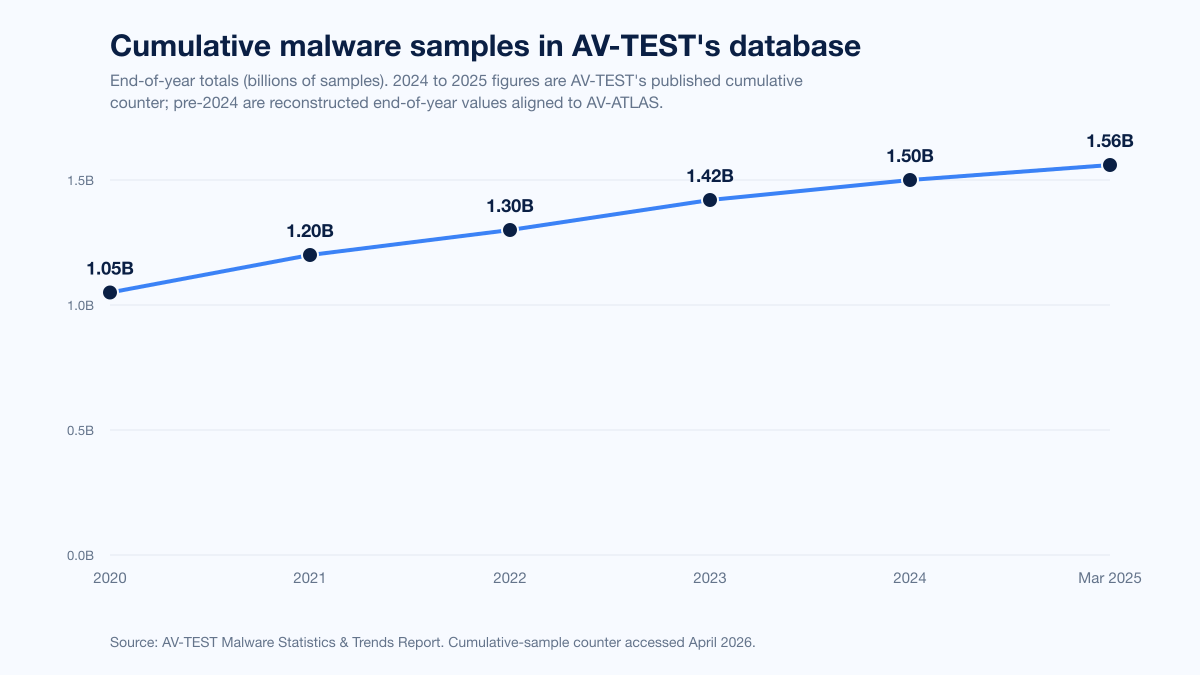
Figure 1: AV-TEST cumulative malware sample count, end-of-year, 2020 through March 2025. The library crossed 1.56 billion samples in March 2025. Source: AV-TEST Malware Statistics & Trends Report.
How big is the malware problem in 2026?
Three datasets anchor the answer.
Sample volume (AV-TEST and abuse.ch)
AV-TEST's live malware tracker shows the cumulative known-sample count at over 1.56 billion as of March 2025, with the institute registering between 450,000 and 560,000 new malware and potentially-unwanted-application samples per day. The Windows-only AV-ATLAS database grew 8% year over year between 2024 and 2025, from 920 million to 995 million Windows samples.
Volume of unique samples is a poor proxy for attack volume because most of those samples are automated variants, packers, and re-obfuscations of a small set of operational families. The community-run abuse.ch URLhaus project tracks roughly 3.65 million malicious URLs as of April 2026, a more useful indicator of distinct distribution endpoints than raw sample counts.
Malware-free intrusions (CrowdStrike)
CrowdStrike's 2025 Global Threat Report, released in February 2025, found 79% of all attack detections in 2024 were malware-free. That share has climbed steadily from 40% in 2019. The 2025 Threat Hunting Report, released in August 2025 and based on H1 2025 OverWatch hunt telemetry, put the malware-free share of interactive intrusions at 81%. eCrime activity made up 73% of all interactive intrusions in the same period.
The same CrowdStrike report quantified the speed of those intrusions: average eCrime breakout time (the gap between initial endpoint compromise and the first lateral movement) dropped to 48 minutes in 2024, with the fastest recorded breakout at 51 seconds. Interactive intrusion campaigns grew 35% YoY in 2024.
Caseload composition (Mandiant)
Mandiant's M-Trends 2025, published April 2025, reports global median dwell time of 11 days for the 2024 IR caseload, up from 10 days in 2023. The asymmetry of how breaches are detected is the most actionable number in the report:
Detection path | 2024 median dwell time | Source |
|---|---|---|
External notification | 26 days | Mandiant M-Trends 2025 |
Internal discovery | 10 days | Mandiant M-Trends 2025 |
Adversary notification (typically ransom note) | 5 days | Mandiant M-Trends 2025 |
JAPAC region | 9 days (fastest) | Mandiant M-Trends 2025 |
EMEA region | 22 days (slowest) | Mandiant M-Trends 2025 |
Mandiant's malware-role taxonomy gives a cleaner read on what families IR teams are actually pulling out of compromised environments than market-share guesses.
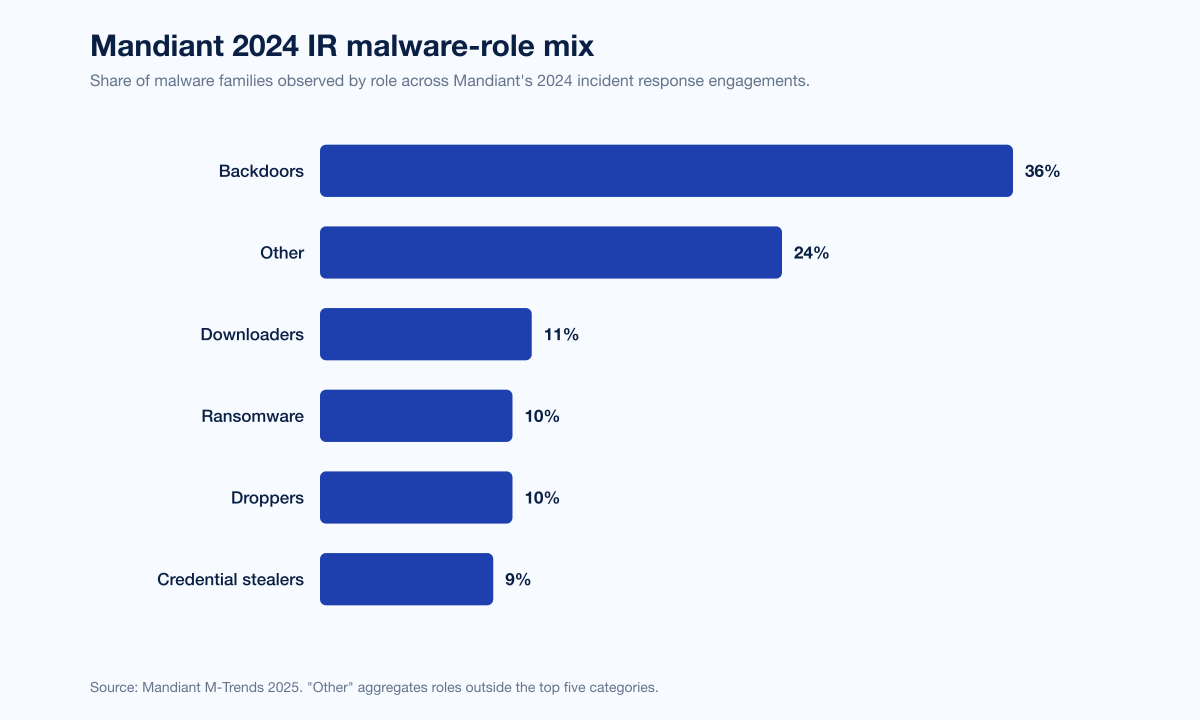
Figure 2: Share of malware families observed in Mandiant 2024 IR investigations by role. Backdoors dominate at 36%, ahead of downloaders (11%), ransomware (10%), droppers (10%), and credential stealers (9%). Source: Mandiant M-Trends 2025.
Malware role | 2024 share of Mandiant-observed malware families | Source |
|---|---|---|
Backdoors | 36% | Mandiant M-Trends 2025 |
Downloaders | 11% | Mandiant M-Trends 2025 |
Ransomware | 10% | Mandiant M-Trends 2025 |
Droppers | 10% | Mandiant M-Trends 2025 |
Credential stealers | 9% | Mandiant M-Trends 2025 |
Other | 24% | Mandiant M-Trends 2025 |
Ransomware's 10% share in 2025 is down from 14% in 2024, a small movement that aligns with Cisco Talos's 2025 Year in Review finding that, for the first time in over a year, commodity malware narrowly surpassed ransomware as the top threat in Cisco Talos Incident Response engagements. Talos credits the closure of several ransomware groups, both voluntary and law-enforcement-driven, for that flip.
BEACON, the implant from Cobalt Strike, continues to be the single most-frequently-observed malware family in Mandiant cases at 5.4% of all 2024 intrusions. That figure is down sharply from 28% in 2021, an erosion Mandiant attributes to Operation MORPHEUS, the 2024 multi-vendor takedown of cracked Cobalt Strike infrastructure.
Initial access vectors
Initial access is where defenders have the most leverage. The 2024 and 2025 publications converge on a small handful of vectors and disagree mostly on the exact percentage split.
Publisher | Top initial access vector(s), most-recent annual report | Share |
|---|---|---|
Mandiant M-Trends 2025 (calendar 2024 IR) | Exploits | 33% |
Mandiant M-Trends 2025 (calendar 2024 IR) | Stolen credentials | 16% |
IBM X-Force Threat Intelligence Index 2025 (calendar 2024 IR) | Exploit of public-facing app (tied) | 30% |
IBM X-Force Threat Intelligence Index 2025 (calendar 2024 IR) | Valid account credentials (tied) | 30% |
Sophos Active Adversary Report 2025 (calendar 2024 IR / MDR) | Compromised credentials | 41% |
Sophos Active Adversary Report 2025 (calendar 2024 IR / MDR) | Exploited vulnerabilities | 21.79% |
Sophos Active Adversary Report 2025 (calendar 2024 IR / MDR) | Brute force | 21.07% |
Verizon 2025 DBIR (Nov 2023 to Oct 2024 breaches) | Compromised credentials | 22% |
Verizon 2025 DBIR (Nov 2023 to Oct 2024 breaches) | Vulnerability exploitation | 20% |
ENISA Threat Landscape 2025 (Jul 2024 to Jun 2025 EU incidents) | Phishing | 60% |
ENISA Threat Landscape 2025 (Jul 2024 to Jun 2025 EU incidents) | Vulnerability exploitation | 21% |
Cisco Talos IR Q1 2025 | Phishing | 50% |
Cisco Talos IR Q2 2025 | Public-facing app exploitation | 60% |
Cisco Talos IR Q2 2025 | Phishing | 33% |
The numbers are not directly comparable because the corpora are different (Mandiant IR vs IBM IR vs DBIR breach corpus vs ENISA EU-incident logs vs Sophos IR / MDR), and "vector" is defined slightly differently in each. The shared signal: exploits, valid credentials, and phishing each carry double-digit share in every dataset, with credentials and exploits tied or near-tied at the top in three of the five major reports.
Sophos's State of Ransomware 2025, based on a Vanson Bourne survey of 3,400 IT and security leaders across 17 countries, isolates the ransomware-specific causation chain. For the third consecutive year, exploited vulnerabilities are the most common root cause of ransomware incidents at 32%, followed by compromised credentials (down from 29% in 2024 to 23% in 2025), malicious email at 19%, and phishing at 18%.
Living-off-the-land tooling
The 79%-malware-free CrowdStrike number gets its plumbing from Sophos's Active Adversary Report 2025, which decomposes what attackers run instead of malicious binaries. RDP appeared in 84% of 2024 cases as the most-abused Microsoft tool. Living-off-the-land binary (LOLBin) abuse grew 126% YoY in 2024, total abused-tool count grew 80% YoY, and the residual "other" tooling category grew 28%. cmd.exe took the lead from RDP as the single most-abused LOLBin in the MDR caseload.
Sophos describes a class of "EDR killer" tools circulating in the criminal marketplace: kernel-driver utilities designed to gain privileged access and terminate protected endpoint-security processes so ransomware can deploy unimpeded. Sophos MDR has tied EDR-killer activity to recent ransomware playbooks and to malvertising campaigns associated with DanaBot, Lumma Stealer, and GootLoader (the same campaigns Microsoft and ESET took down jointly in May 2025).
Infostealers: the load-bearing layer
Infostealers are the most operationally important malware category in the 2024 and 2025 data, and they barely show up in vendor marketing. They run in the background, harvest credentials and session cookies, send the loot to a C2 server, and feed an access-broker marketplace that the ransomware operators buy from.
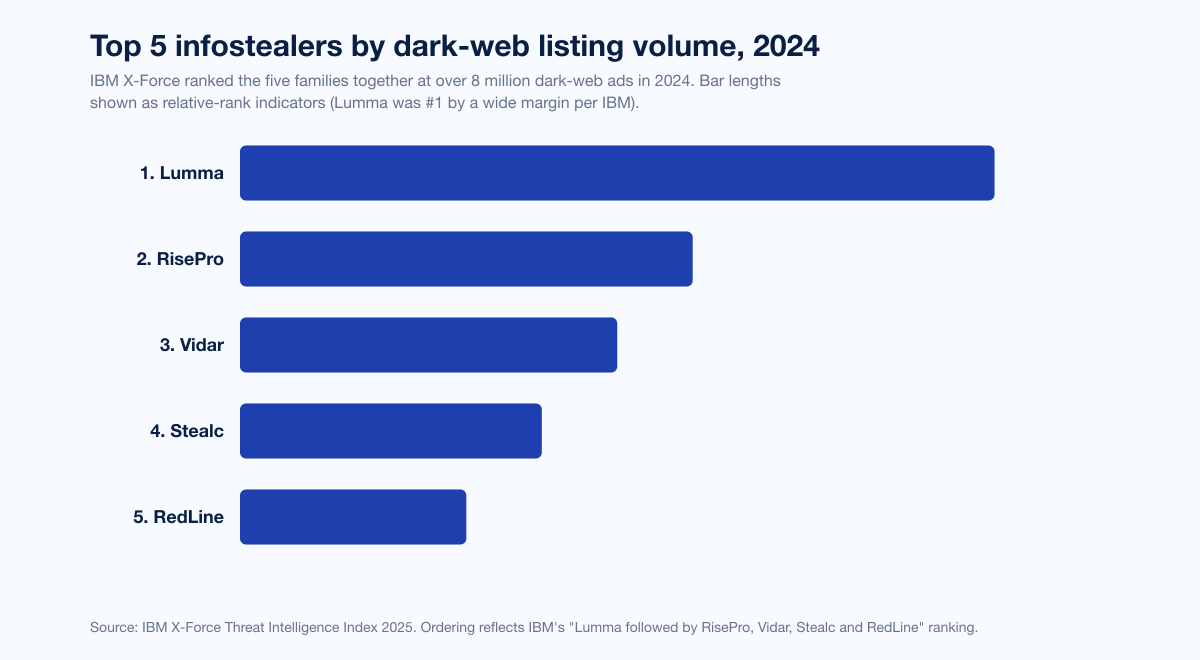
Figure 3: IBM X-Force's 2024 ranking of the top five infostealers by dark-web listing volume. Together the five families produced more than 8 million advertisements. Source: IBM X-Force Threat Intelligence Index 2025.
Rank | Infostealer | Source |
|---|---|---|
1 | Lumma | IBM X-Force Threat Intelligence Index 2025 |
2 | RisePro | IBM X-Force Threat Intelligence Index 2025 |
3 | Vidar | IBM X-Force Threat Intelligence Index 2025 |
4 | Stealc | IBM X-Force Threat Intelligence Index 2025 |
5 | RedLine | IBM X-Force Threat Intelligence Index 2025 |
IBM's X-Force Threat Intelligence Index 2025 measured an 84% YoY uptick in phishing emails delivering infostealers on a weekly basis, and a 12% rise in infostealer credentials for sale on the dark web. The top-five group together produced more than 8 million dark-web advertisements in 2024.
Lumma Stealer is the canonical recent case study. Microsoft's Digital Defense Report 2025 calls it the most prevalent infostealer in the October 2024 to October 2025 telemetry window. Lumma was disrupted in May 2025 by a coalition of Microsoft Digital Crimes Unit, the US Department of Justice, Europol, ESET, BitSight, Lumen, Cloudflare, CleanDNS, and GMO Registry. ESET's Threat Report H1 2025 records Lumma growing 21% in early 2025 (before the takedown), Danabot up 52% in the same window (also disrupted), and SnakeStealer overtaking Agent Tesla as the most-detected infostealer on ESET telemetry, doubling 111% vs H2 2024.
ClickFix and FakeCaptcha (the social-engineering technique where a fake "verify you are human" page tells the user to paste a hidden PowerShell command into Run dialog) became one of the most active malware delivery vectors in early 2025 per ESET, surging 517% in six months and now accounting for 8% of ESET-blocked attacks. The payload at the end of a ClickFix attack varies (infostealer, ransomware, RAT, nation-state malware), and the technique now targets Windows, Linux, and macOS.
Recorded Future's 2025 Identity Threat Landscape Report puts the infostealer economy in concrete numbers. In 2025, Recorded Future indexed:
Metric | 2025 figure | Source |
|---|---|---|
Malware combo-list credential exposures | 1.95 billion | Recorded Future Identity Threat Landscape 2025 |
Database combo-list credential exposures | 36 million | Recorded Future Identity Threat Landscape 2025 |
Credentials with active session cookies (MFA-bypassable on import) | 276 million (31% of malware-sourced) | Recorded Future Identity Threat Landscape 2025 |
Credentials indexed within 1 week of exfiltration | 53% | Recorded Future Identity Threat Landscape 2025 |
Credentials indexed within 24 hours of exfiltration | 36.4% | Recorded Future Identity Threat Landscape 2025 |
Credentials with identifiable auth URLs | 7 million | Recorded Future Identity Threat Landscape 2025 |
Auth URLs tied to authentication systems | 63.2% | Recorded Future Identity Threat Landscape 2025 |
H2 2025 vs H1 2025 credential-exposure growth | +50% | Recorded Future Identity Threat Landscape 2025 |
Q4 2025 vs Q1 2025 credential-exposure growth | +90% | Recorded Future Identity Threat Landscape 2025 |
The most operationally important number in that table is 276 million. Active session cookies on import means the attacker imports the cookie into their own browser and lands inside the target's authenticated session without re-authenticating. MFA does not interrupt that path.
Verizon's 2025 DBIR closes the loop. The team found 25% of all tested malware contained credentials harvested from password stores (Apple Keychain, browser stores, Windows Credential Manager, password managers). It also reported that 30% of infostealer-compromised systems were enterprise-licensed devices, that 54% of ransomware-victim domains had appeared in infostealer logs before the ransomware attack, and that 40% of ransomware victims had corporate email addresses exposed in those logs. The chain looks like infostealer to access broker to ransomware operator, in roughly that sequence.
Malware-free intrusions: what the 79% figure actually means
CrowdStrike's headline number is the most-cited malware statistic of 2025, and it is also the most-misread. Malware-free does not mean "no offensive tooling." It means the initial access and lateral movement happened without dropping a malicious binary on disk that an EDR could match against signatures or behavioral rules. Hands-on-keyboard activity, abuse of legitimate remote-access tools, valid-credential reuse, and OS-native administration utilities all count as malware-free.
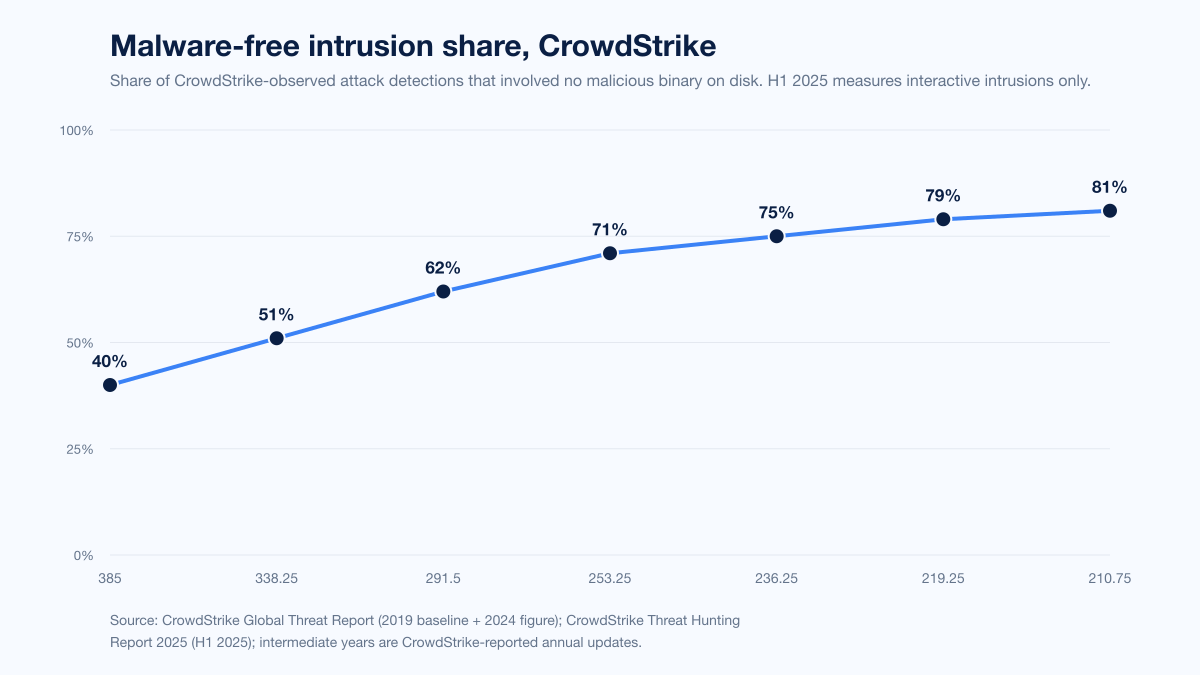
Figure 4: CrowdStrike's malware-free share of attack detections, end of year. The trend shifted sharply between 2022 and 2024 as adversaries pivoted to identity-driven intrusions. H1 2025 figure is from the Threat Hunting Report, which measures malware-free share of interactive intrusions specifically. Sources: CrowdStrike Global Threat Report 2025 and CrowdStrike Threat Hunting Report 2025.
Year | Malware-free share | Notes |
|---|---|---|
2019 | 40% | CrowdStrike historical baseline |
2024 | 79% | All CrowdStrike-observed detections |
H1 2025 | 81% | CrowdStrike interactive-intrusions only |
Two data points from CrowdStrike's 2025 Threat Hunting Report make the operational implication clear:
Cloud intrusions surged 136% in H1 2025 vs all of 2024. Misconfigurations, exposed secrets, and trusted federations are the path. Endpoint AV is not in the trust chain.
FAMOUS CHOLLIMA, a DPRK-nexus adversary, infiltrated 320+ companies over the past year, +220% YoY. The technique was synthetic identities and AI-generated personas applying to remote engineering jobs at US Fortune 500 firms. No malware was needed to land inside the network. The interview was the intrusion.
The 79%-figure is essentially a verdict on the tradecraft shift: adversaries put more effort into identity, less into custom binaries, because the identity path bypasses the largest single category of detection investment.
Industry impact
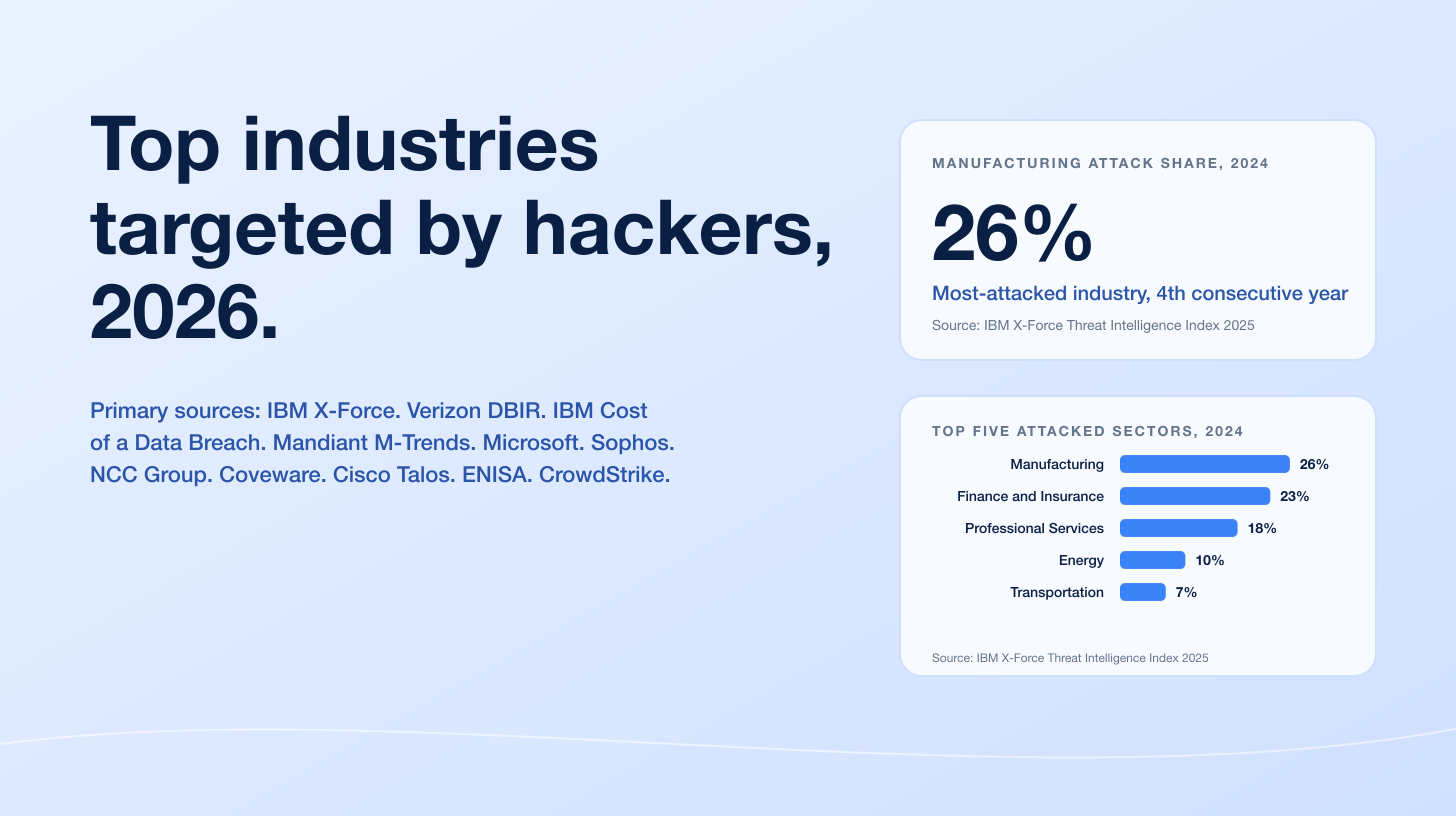
IBM X-Force's 2025 Threat Intelligence Index ranks attack share by industry as follows.
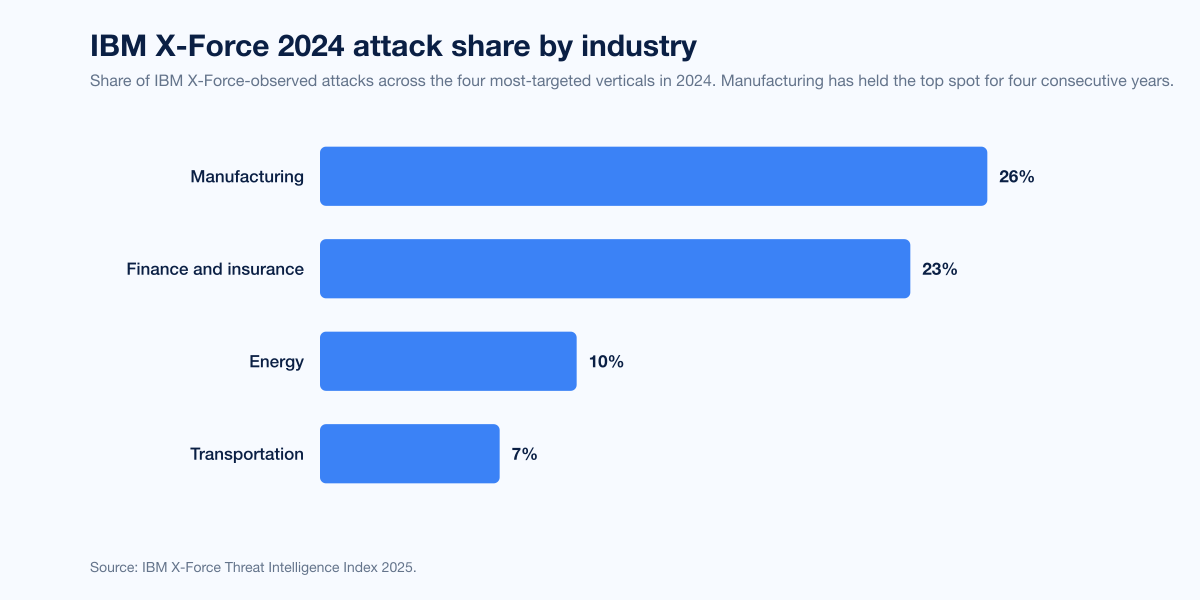
Figure 5: Share of IBM X-Force-observed attacks by industry, 2024. Manufacturing is the most-targeted vertical for the fourth consecutive year. Source: IBM X-Force Threat Intelligence Index 2025.
Industry | 2024 IBM X-Force attack share | Source |
|---|---|---|
Manufacturing | 26% | IBM X-Force Threat Intelligence Index 2025 |
Finance and insurance | 23% | IBM X-Force Threat Intelligence Index 2025 |
Energy | 10% | IBM X-Force Threat Intelligence Index 2025 |
Transportation | 7% | IBM X-Force Threat Intelligence Index 2025 |
In manufacturing specifically, IBM found 40% of 2024 attacks involved data theft targeting financial assets and intellectual property, including trade secrets. Verizon's 2025 DBIR corroborates the manufacturing surge: espionage-motivated breaches in the sector jumped from 3% in the prior year to 20% in 2024, and ransomware attacks against manufacturing grew 61%, making it the single most targeted sector globally in the DBIR corpus.
Healthcare presents a different shape. Verizon's 2025 DBIR contained 1,710 healthcare incidents and 1,542 confirmed healthcare breaches. 90% were financially motivated, but 16% had an espionage motive (up from 1% the year before). SonicWall's 2025 Cyber Threat Report recorded 198 million Americans impacted by ransomware in healthcare in 2024 alone, in part driven by the Change Healthcare breach.
Mandiant's M-Trends 2025 ranks the most-targeted industries differently because its caseload is IR-heavy, not breach-corpus-driven. The Mandiant 2024 ranking was financial (17.4%), business and professional services (11.1%), high tech (10.6%), government (9.5%), and healthcare (9.3%).
ENISA's Threat Landscape 2025 is EU-specific. Across the 4,875 EU incidents in the analysis window, the top three ransomware strains deployed against manufacturing were Akira (48.7% of manufacturing-targeted ransomware), Qilin (20.5%), and FOG (10.3%). Phishing was the dominant intrusion vector at 60% of all incidents.
Ransomware: where the malware-free narrative breaks down
Ransomware is the malware story's exception to the malware-free trend. By the time ransomware payloads run, the operator already has hands-on-keyboard control of the environment, but the detonation event itself is still a malicious binary, and that binary is what gets counted in family-share charts.
NCC Group's 2025 Annual Cyber Threat Intelligence Report documented 2025 as a record year:
Metric | 2025 figure | Source |
|---|---|---|
Tracked ransomware victims (leak sites + telemetry) | 7,874 | NCC Group Annual Cyber Threat Intelligence 2025 |
YoY growth in attack volume | +50% | NCC Group Annual Cyber Threat Intelligence 2025 |
Most active group: Qilin attacks | 1,022 (13%) | NCC Group Annual Cyber Threat Intelligence 2025 |
Industrials target share | 28% | NCC Group Annual Cyber Threat Intelligence 2025 |
North America regional share | 56% | NCC Group Annual Cyber Threat Intelligence 2025 |
Qilin, Akira, and Cl0p were the top three by attack volume in 2025. Verizon's 2025 DBIR recorded ransomware in 44% of all reviewed breaches, up from 32% in the prior year, and 75% of system-intrusion breaches. The asymmetry by company size is striking: ransomware was present in 39% of large-enterprise breaches but 88% of SMB breaches. Ransomware was the top threat for 92% of industries in the DBIR's industry-vertical analysis. Third-party breaches (where the breach entered via a vendor or service provider) rose to 30% of all cases, double the prior year's share.
Sophos's State of Ransomware 2025 captures ransom payment economics from 3,400 organizations:
Metric | 2025 figure | Source |
|---|---|---|
Average recovery cost (excluding ransom) | US$1.53M (-44% YoY) | Sophos State of Ransomware 2025 |
Share of victims that paid the ransom | 49% (down from 56% in 2024) | Sophos State of Ransomware 2025 |
Share of attacks that resulted in data encryption | 50% (down from 70% in 2024) | Sophos State of Ransomware 2025 |
Median ransom paid, state and local government | US$2.5M | Sophos State of Ransomware 2025 |
Median ransom paid, healthcare | US$150,000 | Sophos State of Ransomware 2025 |
Average payment vs initial demand | 85% of demand | Sophos State of Ransomware 2025 |
Coveware's Q4 2025 quarterly report tells a sharper story for the most-recent quarter:
Metric | Q4 2025 | Source |
|---|---|---|
Median ransom payment | US$325,000 (+132% QoQ) | Coveware Q4 2025 |
Average ransom payment | US$591,988 (+57% QoQ) | Coveware Q4 2025 |
Ransom payment rate | 20% (historic low) | Coveware Q4 2025 |
The 20% payment rate is the headline. Coveware's 12-quarter trend shows organizations getting better at restoring operations without paying, and the tail of organizations that do pay is small but expensive (the average is multiples of the median because a few large settlements drag the mean upward).
IBM's Cost of a Data Breach Report 2025, published August 2025 from a Ponemon Institute survey of 600 breached organizations, puts the global average cost of a data breach at US$4.44M (down 9% from US$4.88M in 2024) but the average cost of an extortion or ransomware-specific incident at US$5.08M, with 63% of organizations now refusing to pay ransom demands (up from 59% the prior year). In the United States specifically, the average breach cost rose to US$10.22M, a record high.
Vulnerability exploitation: the CISA KEV signal
CISA's Known Exploited Vulnerabilities (KEV) catalog is the public-sector counterpart to vendor-IR malware reporting. CISA added 245 vulnerabilities to the KEV catalog in 2025, bringing the cumulative total to 1,484. That is more than 30% above the steady pace of 187 (2023) and 185 (2024) annual additions. CISA flagged 24 of the 2025 additions as known to be exploited by ransomware groups, including CVE-2025-5777 (CitrixBleed 2) and a cluster of Oracle E-Business Suite vulnerabilities that CL0P leveraged.
SonicWall's 2025 Cyber Threat Report tracks the speed of weaponization at the network-firewall layer. SonicWall found 75% of exploits occur within four days of public proof-of-concept disclosure, with 61% striking inside 48 hours. Average organizations take between 120 and 150 days to apply a patch, leaving a four-month exposure window in which attackers know the exploit and defenders have not yet closed it.
SonicWall's RTDMI engine identified 210,258 unique never-before-seen malware variants in 2024, an average of more than 630 per day, and recorded an 8% YoY rise in overall malware blocked. North America saw an 8% YoY increase in ransomware; LATAM saw a 259% surge.
Specific corporate cost data: the FBI IC3 baseline
The FBI Internet Crime Complaint Center's 2024 Internet Crime Report, published April 2025, is the largest-corpus public dataset of US victim losses. The 2024 numbers:
Metric | 2024 figure | Source |
|---|---|---|
Total reported cybercrime losses | US$16.6B (+33% YoY) | FBI IC3 2024 Internet Crime Report |
Complaints filed | 859,532 | FBI IC3 2024 Internet Crime Report |
Cyber-enabled fraud share of complaints | 38% (333,981 complaints) | FBI IC3 2024 Internet Crime Report |
Cyber-enabled fraud share of losses | 83% (US$13.7B) | FBI IC3 2024 Internet Crime Report |
Tech support fraud losses | US$1.6B | FBI IC3 2024 Internet Crime Report |
Ransomware complaint growth YoY | +9% | FBI IC3 2024 Internet Crime Report |
Reported losses from "general malware" category | US$1.3M | FBI IC3 2024 Internet Crime Report |
Reported losses from "botnets" category | US$9M | FBI IC3 2024 Internet Crime Report |
The "general malware" and "botnet" categories carry suspiciously low totals because the FBI's reporting taxonomy classifies most ransomware, BEC, and infostealer-driven losses under those incident types directly, not under malware-as-a-vector. The US$16.6B headline is the comprehensive number; the US$1.3M malware-line is a residual.
Microsoft daily-telemetry baselines
Microsoft's Digital Defense Report 2025 publishes the only consistently-collected vendor telemetry at internet scale. Microsoft processes more than 100 trillion signals per day, blocks approximately 4.5 million new malware attempts, analyzes 38 million identity-risk detections, and screens 5 billion emails for malware and phishing. The report's H1 2025 finding: identity-based attacks surged 32% YoY, and 97% of identity attacks were password-spray attempts. Microsoft's accompanying announcement puts extortion and ransomware at over half of all observed cyberattacks in the same window.
AI as malware: the new attack surface
The cleanest 2025 data on AI in attack chains comes from IBM's Cost of a Data Breach Report 2025. 1 in 6 IBM-tracked breaches involved attackers using AI, most commonly for phishing (37%) and deepfake impersonation (35%). Shadow AI (the unsanctioned use of AI by employees) was a factor in 20% of breaches, adding US$670,000 to average costs.
Anthropic's August 2025 Threat Intelligence Report and November 2025 incident report on the first AI-orchestrated cyber espionage campaign are the most concrete published evidence of generative-AI-orchestrated malicious activity:
Anthropic-published finding, 2025 | Detail | Source |
|---|---|---|
Ransomware-package marketplace pricing | US$400 to US$1,200 per package | Anthropic Threat Intelligence Report August 2025 |
Chinese state-sponsored AI-orchestrated targets | ~30 global targets | Anthropic Disrupting AI Espionage, November 2025 |
Share of tactical operations executed autonomously by AI | 80% to 90% | Anthropic Disrupting AI Espionage, November 2025 |
North Korean operative use case | Synthetic identities + Claude-assisted technical assessments to land remote roles at US Fortune 500 firms | Anthropic Threat Intelligence Report August 2025 |
The November 2025 incident is the watershed: a state-sponsored adversary used Claude Code as a multi-agent orchestration platform that ran 80% to 90% of tactical operations independently, with humans reviewing and approving high-stakes decisions only. The campaign hit roughly 30 global targets. Anthropic says the campaign was disrupted; the model is not.
Verizon's 2025 DBIR found malicious emails crafted with generative AI doubled in the last two years. 14% of employees were using GenAI tools on corporate devices, and 72% of those users were authenticating to GenAI services with personal emails or unauthenticated sessions, leaving the corporate side blind to what was being shared.
Detection and dwell time
Five numbers compress the entire detection picture for 2024 and 2025:
Number | Source |
|---|---|
11 days global median dwell time, 2024 | |
26 days dwell time when externally notified | |
5 days dwell time when adversary notified (typical ransomware case) | |
48 minutes average eCrime breakout time, 2024 | |
51 seconds fastest recorded eCrime breakout time |
Five days is faster than dwell time has ever been, but it is also the worst outcome (the "adversary-notified" case is the ransom-note case). External notification is the second-worst outcome and is twice as slow as internal discovery. The signal: organizations that detect breaches internally are still ahead of the adversary, but only barely, and only on average.
Cisco Talos's quarterly IR Trends reports add quarter-by-quarter granularity. Q1 2025 saw phishing in half of all engagements; Q2 2025 saw public-facing-app exploitation in over 60% of engagements as phishing fell to 33%. Q3 2025 introduced two new high-signal numbers: MFA weakness was found in 35% of engagements (a quarter-over-quarter rise), and fraudulent device registration grew 178% YoY, with attackers convincing administrators to register devices on their behalf at three times the rate of users.
Frequently Asked Questions
Who publishes the most-cited malware statistics for 2026?
For raw sample volume, AV-TEST (1.56 billion cumulative samples through March 2025) is the canonical reference. For breach corpus, the Verizon 2025 DBIR (12,195 confirmed breaches Nov 2023 to Oct 2024) is the largest publicly-released dataset. For incident-response telemetry, Mandiant's M-Trends 2025 is the most-quoted IR number, alongside IBM's X-Force Threat Intelligence Index 2025. For the malware-free intrusion shift, CrowdStrike's 2025 Global Threat Report and 2025 Threat Hunting Report own the most-cited figure (79% of 2024 detections, 81% of H1 2025 interactive intrusions). For ransomware specifically, Sophos's State of Ransomware 2025, NCC Group's Annual Cyber Threat Intelligence 2025, and Coveware's Q4 2025 report are the top three.
How big is the malware database in 2026?
AV-TEST registered its 1.56 billionth cumulative malware sample in March 2025, with daily new-sample registrations between 450,000 and 560,000. The Windows-only AV-ATLAS database grew 8% YoY between 2024 and 2025, from 920 million to 995 million Windows samples. abuse.ch's URLhaus tracks roughly 3.65 million malicious URLs as of April 2026. Volume of unique samples is a poor proxy for attack volume because most additions are automated variants, packed re-issues, and AI-assisted mutations of a small set of operational families.
What is the most-prevalent infostealer in 2026?
Microsoft's Digital Defense Report 2025 names Lumma Stealer as the most prevalent infostealer in its October 2024 to October 2025 telemetry. Lumma was disrupted by a multi-vendor takedown in May 2025. IBM's X-Force Threat Intelligence Index 2025 ranks the top five infostealers by dark-web listing volume as Lumma, RisePro, Vidar, Stealc, and RedLine, together producing more than 8 million dark-web ads in 2024. ESET's Threat Report H1 2025 reports SnakeStealer overtaking Agent Tesla as the most-detected infostealer in ESET telemetry, with a 111% jump vs H2 2024.
What share of attacks involve no malware in 2026?
CrowdStrike measured 79% of all 2024 attack detections as malware-free and 81% of H1 2025 interactive intrusions as malware-free. The number rose from 40% in 2019. Malware-free does not mean attackers used no offensive tooling; it means initial access and lateral movement happened without dropping a malicious binary on disk that endpoint protection could match against signatures or behavioral rules. Sophos's Active Adversary Report 2025 decomposes the same trend: living-off-the-land binary abuse grew 126% YoY in 2024, RDP abuse appeared in 84% of cases, and 56% of all Sophos IR / MDR cases involved attackers logging in via valid credentials rather than breaking in.
What initial access vectors lead to the most malware-driven breaches in 2026?
Across the major 2024 and 2025 reports, exploitation of public-facing applications, valid account credentials, and phishing each carry double-digit share. IBM X-Force's Threat Intelligence Index 2025 tied exploits and valid credentials at 30% each in calendar 2024. Mandiant's M-Trends 2025 found exploits at 33% and stolen credentials at 16%. Sophos's Active Adversary Report 2025 put compromised credentials at 41% and exploits at 21.79%. Verizon's 2025 DBIR reported credential abuse in 22% and vulnerability exploitation in 20% of all reviewed breaches. ENISA's Threat Landscape 2025 put phishing at 60% and vulnerability exploitation at 21% of EU incidents.
Which industries are hit hardest by malware in 2026?
IBM X-Force ranked 2024 attack share by industry as manufacturing 26%, finance and insurance 23%, energy 10%, and transportation 7%. Manufacturing has held the top spot for four consecutive years. In manufacturing specifically, 40% of attacks involved data theft targeting financial assets and intellectual property. Verizon's 2025 DBIR saw espionage-motivated breaches in manufacturing rise from 3% to 20% YoY and ransomware attacks against manufacturing grow 61%. Mandiant's M-Trends 2025 ranks the most-targeted IR-engagement industries differently: financial 17.4%, business and professional services 11.1%, high tech 10.6%, government 9.5%, healthcare 9.3%.
How fast do attackers move once they get a foothold?
CrowdStrike's 2025 Global Threat Report measured an average eCrime breakout time of 48 minutes in 2024, with the fastest recorded breakout at 51 seconds. Breakout time is the gap between initial endpoint compromise and the first lateral movement. Interactive intrusion campaigns grew 35% YoY in 2024. Mandiant's M-Trends 2025 clocked global median dwell time at 11 days for the 2024 IR caseload (10 days the year before), but the asymmetry by detection path matters more than the headline: 26 days when external entities notified the victim, 5 days when the adversary themselves notified (typically via ransom note), 10 days when the organization discovered the breach internally. JAPAC was fastest at 9 days, EMEA slowest at 22 days.
How are ransomware payment rates trending in 2026?
Coveware's Q4 2025 quarterly report put the ransom payment rate at a historic low of 20% in Q4 2025, with the median ransom payment rising to US$325,000 (+132% QoQ) and the average to US$591,988 (+57% QoQ). Sophos's State of Ransomware 2025 found 49% of victims paid the ransom in the survey window, down from 56% in 2024. IBM's Cost of a Data Breach Report 2025 reported 63% of breached organizations now refuse to pay ransom demands (up from 59% the prior year). The bifurcation: more victims walk away, but those that do pay are paying significantly more, with state and local government leading at a US$2.5M median per Sophos.
How much credential theft is happening in 2026?
Recorded Future's 2025 Identity Threat Landscape Report indexed 1.95 billion malware-sourced combo-list credentials and 36 million database combo-list credentials in 2025. Of the 1.95 billion, 276 million (31%) carried active session cookies, meaning attackers can import the cookie into their own browser and bypass MFA on entry. 53% of all stolen credentials were indexed within one week of exfiltration; 36.4% within 24 hours. The H2 2025 was 50% larger than H1 2025; Q4 2025 was 90% larger than Q1 2025. Verizon's 2025 DBIR corroborates that 25% of all tested malware contained credentials harvested from password stores, that 30% of infostealer-compromised systems were enterprise-licensed, and that 54% of ransomware-victim domains had appeared in infostealer logs before the attack.
How is AI changing the malware landscape in 2026?
IBM's Cost of a Data Breach Report 2025 found 1 in 6 breaches involved attackers using AI, most commonly for phishing (37%) and deepfake impersonation (35%). Shadow AI (unsanctioned use by employees) was a factor in 20% of breaches, adding US$670,000 to average costs. Microsoft's Digital Defense Report 2025 documents adversary use of generative AI for social engineering scaling, automated lateral movement, and vulnerability discovery. Anthropic disclosed in November 2025 the first publicly-documented AI-orchestrated cyber espionage campaign, in which a Chinese state-sponsored group used Claude Code to execute 80% to 90% of tactical operations against roughly 30 global targets autonomously. Verizon's 2025 DBIR found malicious emails crafted with generative AI doubled in the last two years.
What does CISA say about exploited vulnerabilities and malware in 2026?
CISA added 245 vulnerabilities to its Known Exploited Vulnerabilities catalog in 2025, bringing the cumulative total to 1,484. The 2025 add-rate is more than 30% above the steady pace of 187 (2023) and 185 (2024). 24 of the 2025 additions were marked as known to be exploited by ransomware groups, including CitrixBleed 2 (CVE-2025-5777) and Oracle E-Business Suite vulnerabilities targeted by CL0P. SonicWall's 2025 Cyber Threat Report found 75% of exploits occur within four days of public proof-of-concept disclosure, with 61% striking inside 48 hours, while average organizations take 120 to 150 days to apply a patch.
What can organizations do to defend against malware-driven breaches in 2026?
Five practical steps that the data supports.
First, treat infostealers as a credential-harvest vector, not a Windows-AV problem. The Verizon 2025 DBIR's 54% infostealer-precedes-ransomware figure says credential rotation, session-cookie invalidation on infostealer-detection events, and FIDO2 hardware-key MFA close the largest single attack chain in the data.
Second, assume valid credentials and living-off-the-land tradecraft are the default. CrowdStrike's 79% malware-free intrusion rate and Sophos's 56% logged-in-vs-broke-in figure mean signature-based EDR is necessary but not sufficient. Identity-threat detection (anomalous sign-ins, impossible travel, session-cookie heuristics) and behavioral telemetry on RDP and PowerShell are where defenders need budget in 2026.
Third, patch what CISA names. The 245 KEV additions in 2025 are a finite, ranked list of vulnerabilities that adversaries are actively using. The 24 ransomware-flagged subset is the highest-priority list. SonicWall's 75%-within-four-days exploit window means a 30-day patch SLA is structurally late.
Fourth, exercise the assumed-breach scenario. Mandiant's 5-day adversary-notified dwell time is the worst-case outcome, and 26-day external-notification dwell time is the second-worst. Internal discovery (10 days median) is the only path that gives defenders meaningful response window. Tabletop exercises that include valid-credential-driven lateral movement, infostealer-then-ransomware chains, and EDR-killer scenarios are the highest-leverage prep.
Fifth, audit GenAI usage. The Verizon 2025 DBIR's 14%-employees-on-corp-devices and 72%-personal-account figures put a measurable risk on shadow AI, and IBM's US$670,000-extra-breach-cost from shadow AI is a clear ROI case for sanctioned, monitored GenAI access.
For a deeper procedural walkthrough of how Stingrai's red-team and PTaaS engagements simulate the exact valid-credential and infostealer-driven chains in this report, see our PTaaS service overview and Stingrai's complete penetration testing methodology. Buyers comparing managed offensive-security partners can review our 2026 ranking of the best PTaaS providers and the best penetration testing companies in 2026.
References
AV-TEST Institute. Malware Statistics & Trends Report. https://www.av-test.org/en/statistics/malware/
Mandiant / Google Cloud. M-Trends 2025: Data, Insights, and Recommendations From the Frontlines. April 2025. https://cloud.google.com/blog/topics/threat-intelligence/m-trends-2025
IBM X-Force. Threat Intelligence Index 2025. April 2025. https://www.ibm.com/think/x-force/x-force-threat-intelligence-index-2025-attackers-steal-sell-user-identities
IBM Security. Cost of a Data Breach Report 2025. August 2025. https://www.ibm.com/reports/data-breach
CrowdStrike. 2025 Global Threat Report. February 2025. https://www.crowdstrike.com/en-us/press-releases/crowdstrike-releases-2025-global-threat-report/
CrowdStrike. 2025 Threat Hunting Report. August 2025. https://www.crowdstrike.com/en-us/resources/reports/threat-hunting-report/
Microsoft. Digital Defense Report 2025. October 2025. https://www.microsoft.com/en-us/security/security-insider/threat-landscape/microsoft-digital-defense-report-2025
Microsoft On the Issues. Extortion and ransomware drive over half of cyberattacks. October 2025. https://blogs.microsoft.com/on-the-issues/2025/10/16/mddr-2025/
Sophos. State of Ransomware 2025. June 2025. https://www.sophos.com/en-us/content/state-of-ransomware
Sophos. 2025 Active Adversary Report: It takes two. April 2025. https://news.sophos.com/en-us/2025/04/02/2025-sophos-active-adversary-report/
ESET. Threat Report H1 2025. June 2025. https://www.welivesecurity.com/en/eset-research/eset-threat-report-h1-2025/
ESET. ESET takes part in global operation to disrupt Lumma Stealer. May 2025. https://www.eset.com/us/about/newsroom/research/eset-takes-part-in-global-operation-to-disrupt-lumma-stealer-one-of-the-most-prevalent-infostealers/
SonicWall. 2025 Cyber Threat Report. February 2025. https://www.sonicwall.com/resources/white-papers/2025-sonicwall-cyber-threat-report
Verizon Business. 2025 Data Breach Investigations Report. April 2025. https://www.verizon.com/business/resources/reports/dbir/
ENISA. Threat Landscape 2025. October 2025. https://www.enisa.europa.eu/publications/enisa-threat-landscape-2025
Coveware. Q4 2025 Quarterly Ransomware Report: Insider Threats Loom while Ransom Payment Rates Plummet. January 2026. https://www.coveware.com/blog/2025/10/24/insider-threats-loom-while-ransom-payment-rates-plummet
Recorded Future. 2025 Identity Threat Landscape Report. March 2026. https://www.recordedfuture.com/blog/identity-trend-report-march-blog
NCC Group. Annual Cyber Threat Intelligence 2025. January 2026. https://www.nccgroup.com/newsroom/ncc-group-annual-cyber-threat-intelligence-2025/
Cisco Talos. 2025 Year in Review. April 2026. https://blog.talosintelligence.com/2025yearinreview/
Cisco Talos. IR Trends Q1 2025. April 2025. https://blog.talosintelligence.com/ir-trends-q1-2025/
Cisco Talos. IR Trends Q2 2025. July 2025. https://blog.talosintelligence.com/ir-trends-q2-2025/
FBI Internet Crime Complaint Center. 2024 Internet Crime Report. April 2025. https://www.ic3.gov/AnnualReport/Reports/2024_IC3Report.pdf
CISA. Known Exploited Vulnerabilities Catalog. https://www.cisa.gov/known-exploited-vulnerabilities-catalog
abuse.ch. URLhaus. https://urlhaus.abuse.ch/
abuse.ch. MalwareBazaar. https://bazaar.abuse.ch/
Anthropic. Threat Intelligence Report: August 2025. August 2025. https://www.anthropic.com/news/detecting-countering-misuse-aug-2025
Anthropic. Disrupting the first reported AI-orchestrated cyber espionage campaign. November 2025. https://www.anthropic.com/news/disrupting-AI-espionage