You build the business case for continuous penetration testing on one number: the drift window. That is the stretch of time between your last annual pentest and your next one, during which you keep shipping code, adding integrations, and rotating infrastructure while your most recent security assurance quietly goes stale. A traditional annual test certifies a snapshot. Your attack surface is a moving target. The budget argument for continuous testing is that the cost of leaving that window uncovered now exceeds the cost of covering it, because attackers weaponize new vulnerabilities in days while annual tests leave roughly 360 days unverified.
This post is written for the security leader who has to walk into a finance review and justify continuous testing spend to a CFO and a board that are, correctly, skeptical of open-ended security budgets. It gives you an ROI framework, an illustrative cost-of-a-missed-vulnerability model, a coverage-gap argument, and a one-page board summary template you can adapt and take into the room. Every external figure below carries its source so any claim can be audited before you put it in front of finance.
How do I build the business case for continuous penetration testing and justify the budget to my CFO?
Lead with risk retired per dollar, not with activity. A CFO does not buy "more pentests." A CFO buys a measurable reduction in expected loss, and a coverage story that survives an audit and a cyber-insurance questionnaire. The business case for continuous penetration testing has four moving parts:
The exposure you are retiring. Quantify the drift window, the days between annual tests when new code and new vulnerabilities go untested, and attach an illustrative loss figure anchored to a credible breach-cost benchmark.
The coverage you are buying. Continuous testing converts a once-a-year snapshot into assurance that tracks change, re-testing on deployment and gating pull requests so vulnerable code is caught before it merges.
The remediation economics. A flaw caught at pull-request time costs a fraction of the same flaw caught after it ships, or after an attacker finds it first.
The second-order leverage. Continuous evidence strengthens SOC 2, ISO 27001, PCI DSS 4.0, and DORA programs, and gives you a stronger hand on cyber-insurance premiums and claims.
Answer the CFO's real question early: continuous penetration testing is not a bigger version of the annual test. It is a different risk posture. You are trading a large, unmanaged tail risk (a critical flaw living untested for months) for a predictable operating cost. That trade is the entire pitch.
The drift window: why annual testing leaves you exposed
The annual penetration test is a point-in-time certification. The moment the report is delivered, its accuracy begins to decay, because your environment does not stop changing. Every deployment, dependency bump, feature flag, and new third-party integration is a change your last test never saw.
Two hard numbers define the problem.
First, attackers move fast. The median time to weaponize a newly disclosed vulnerability has collapsed to 5 days, down from 32 days the year prior, according to Mandiant's M-Trends 2025 report (published April 2025, Google Cloud). When exploitation lands in days, an annual cadence is not a cadence at all. It is a single measurement surrounded by roughly 360 days of unverified change.
Second, that gap is exactly where breaches are landing. Vulnerability exploitation rose to 20% of breaches, up 34% year over year, per the Verizon 2025 Data Breach Investigations Report, and Verizon found that only 54% of edge-device and VPN vulnerabilities were fully remediated, at a median of 32 days to patch. Exploits remain the most common initial infection vector at 33% of intrusions, ahead of stolen credentials at 16%, in Mandiant's M-Trends 2025.
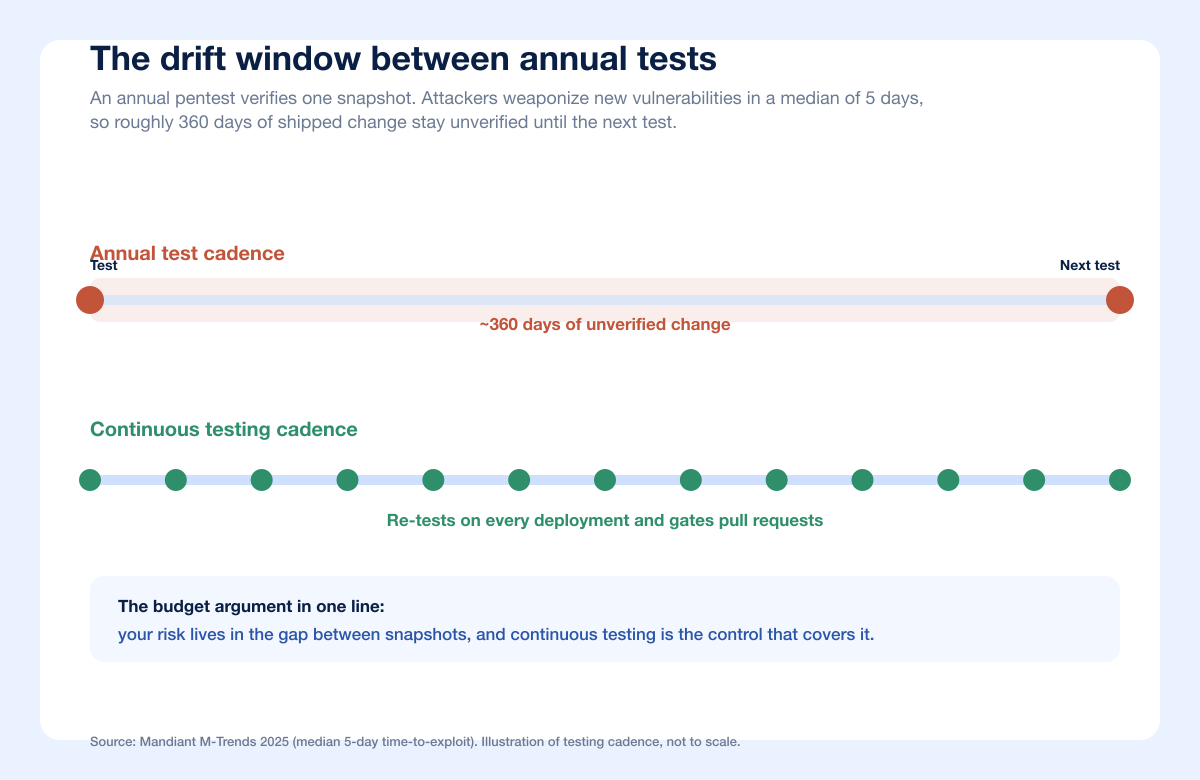
The drift-window argument reframes the spend. You are not asking to test more often for its own sake; you are asking to close a window attackers have already learned to exploit inside of. The annual test verifies the environment on day zero. Continuous testing verifies it on the day the change ships, which is the only day that matters once weaponization takes days.
Why this is worse for teams that ship fast
The faster your engineering org ships, the wider your drift window opens. A team deploying weekly accumulates roughly fifty untested change events before the next annual engagement. Each new endpoint, authorization check, and data-access path is a place an IDOR, broken-authorization flaw, or business-logic bug can be introduced without any test seeing it until the following year. Velocity is a business asset, but it silently inflates the risk the annual test was supposed to retire.
An ROI framework for continuous penetration testing
Finance evaluates security spend the way it evaluates any other risk-reduction investment: expected loss avoided, per dollar of cost, with a defensible model behind the numbers. Here is a four-part framework you can bring straight into a budget review.
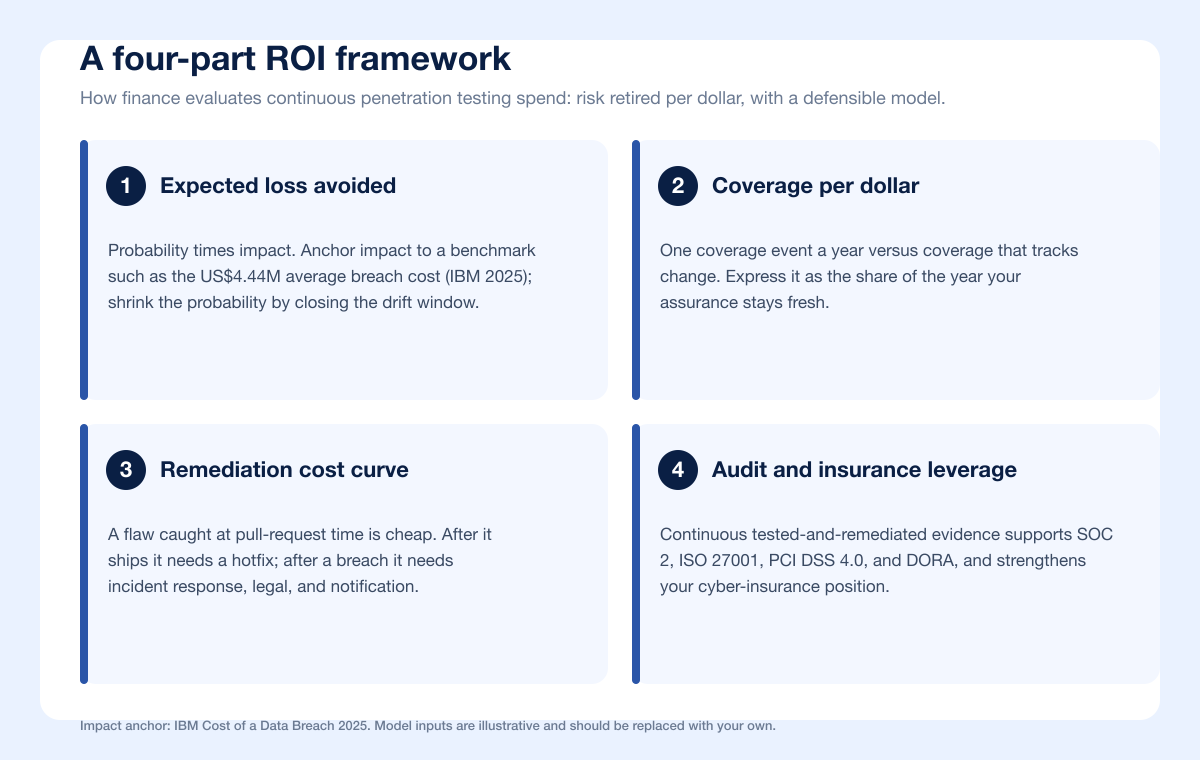
1. Expected loss avoided
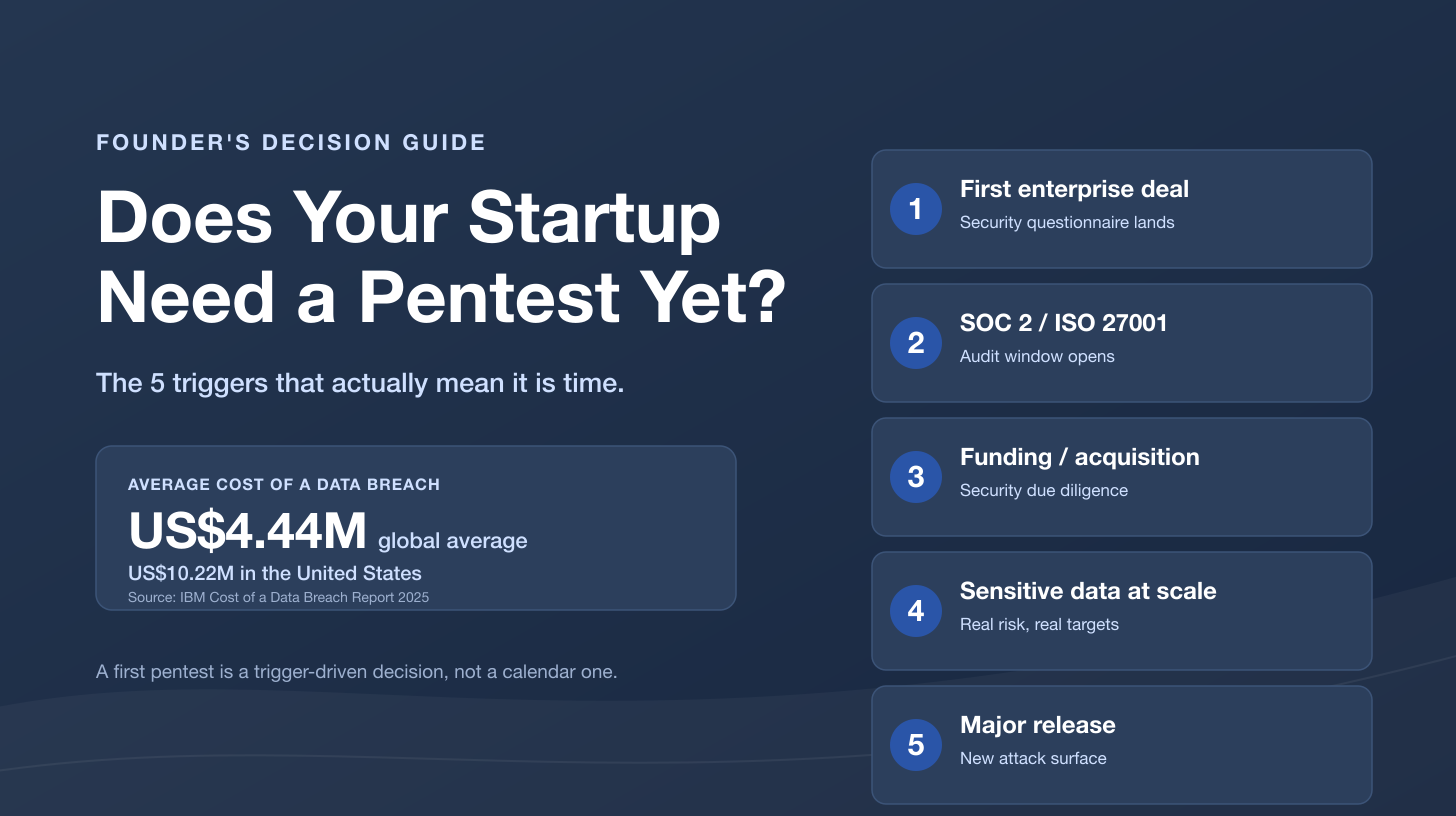
Expected loss is probability multiplied by impact. For a serious web-application breach, anchor impact to a credible benchmark: the global average cost of a data breach is US$4.44M (IBM Cost of a Data Breach 2025), down 9% from the prior year but still the number a board will recognize. You do not need to claim your organization will suffer the average. You need to show that continuous testing lowers the probability term by shrinking the drift window in which an exploitable flaw can go undetected.
Frame it as a simple, clearly-labeled illustrative calculation. If continuous testing plausibly reduces the annual probability of a drift-window breach by even a modest amount, multiply that probability reduction by your chosen impact figure to get expected loss avoided. Keep every input visible and conservative so finance can stress-test it.
2. Coverage per dollar
The annual test gives you one coverage event per year. Continuous testing gives you coverage that tracks change. Express this as a ratio the board can hold onto: with an annual test, the percentage of the year your latest assurance is fresh is low and decaying; with continuous testing, it stays high because every material change triggers a re-test. This is the metric that reframes the conversation from cost to coverage.
3. The remediation cost curve
A vulnerability caught at pull-request time is cheap to fix. The same vulnerability caught after it ships requires a hotfix, a redeploy, and often an incident review. The same vulnerability caught by an attacker requires incident response, legal, notification, and remediation, and it is here that the IBM breach lifecycle figure bites: organizations take a mean of 241 days to identify and contain a breach (IBM Cost of a Data Breach 2025). The earlier in that curve you catch the flaw, the cheaper it is by orders of magnitude. Continuous testing pushes detection to the left, toward the pull request.
4. Audit and cyber-insurance leverage
Continuous testing evidence is not only a security asset. It is an audit and underwriting asset. A continuous stream of tested-and-remediated findings strengthens your SOC 2, ISO 27001, PCI DSS 4.0, and DORA programs, and it is exactly the kind of proactive control posture cyber-insurers reward. Fold this into the ROI case: some of the spend is offset by smoother audits and a stronger position on premiums and claims.
An illustrative cost-of-a-missed-vulnerability model
The single most persuasive artifact in a budget review is a model that puts a dollar figure on the thing you are trying to prevent. Below is an illustrative model. Every number here is an example you should replace with your own inputs; the point is the structure, not the specific figures.
Model a single critical web-application flaw, for example an IDOR that exposes another tenant's records, or a broken-authorization bug that lets a standard user reach admin functionality. Then compare two worlds.
Model input (illustrative) | Caught at PR time (continuous) | Missed until drift-window breach |
|---|---|---|
When it is found | Before merge, day 0 | After exploitation, months later |
Engineering fix cost | Low: one PR, no incident | High: hotfix, redeploy, review |
Detection and containment time | Not applicable | Mean 241 days (IBM 2025) |
Incident response and legal | None | Material |
Modeled impact anchor | Avoided | Up to US$4.44M average (IBM 2025) |
Regulatory and notification exposure | None | Possible, jurisdiction-dependent |
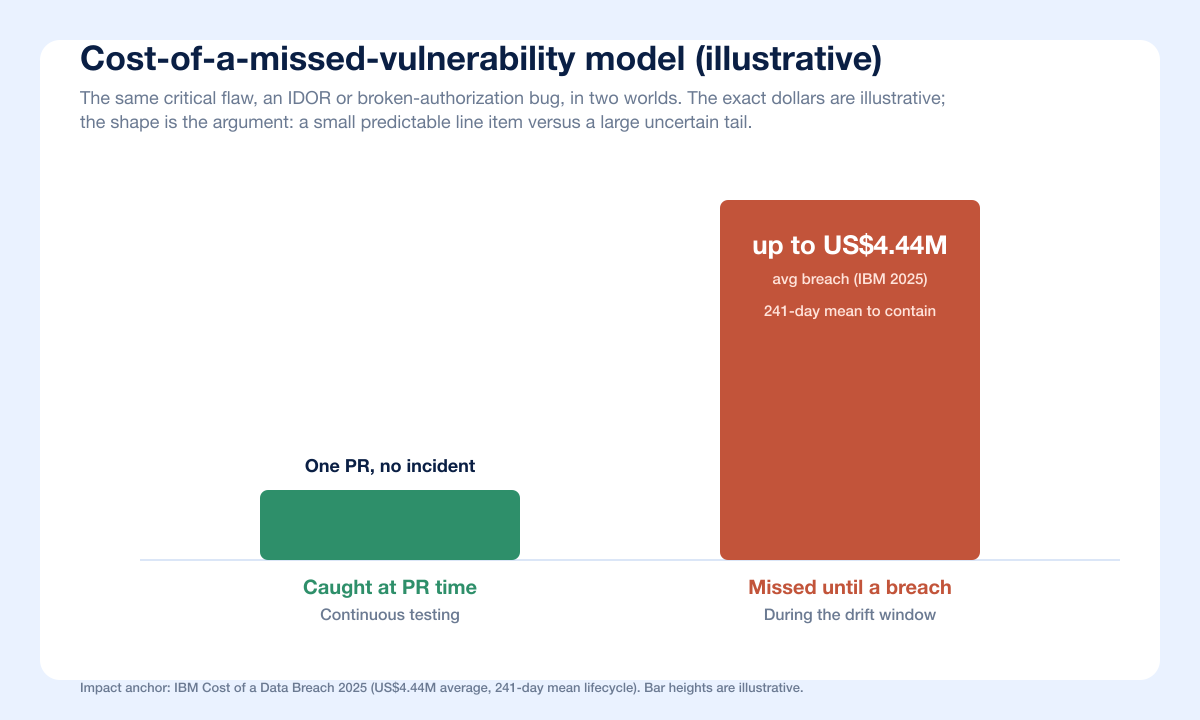
The model's power is not the exact dollar figure. It is the shape of the two bars. One is a small, predictable line item. The other is a large, uncertain tail. Continuous penetration testing is, in finance terms, the purchase that converts the second bar into the first. When you present this, be explicit that the numbers are illustrative and that the impact anchor is a third-party benchmark, not a promise about your specific environment. Credibility with a CFO comes from conservative, sourced inputs, not from a scary headline number.
Why the missed flaw is usually a complex one
The vulnerabilities most likely to survive the drift window are not the noisy, known-class bugs a scanner catches on every run. They are the complex ones: IDOR, broken authorization, and business-logic flaws that depend on how your specific application handles identity, state, and access. These require reasoning about intended behavior, which is precisely why they slip through automated scans and why they are so valuable to an attacker. A continuous testing capability that can actually reach these classes, rather than re-flagging the same known-class findings, is what makes the coverage real.
The coverage-gap argument in one slide
When you distill the whole case to a single slide, it is this: annual testing certifies a snapshot; your risk lives in the space between snapshots. Continuous testing covers that space. The three supporting facts, all sourced, are:
Weaponization is faster than your cadence. Median 5 days to exploit a new vulnerability (Mandiant M-Trends 2025) versus roughly 360 days of drift between annual tests.
Exploitation is where breaches are growing. Up 34% year over year to 20% of breaches (Verizon 2025 DBIR).
Detection is slow when you rely on finding out later. Mean 241 days to identify and contain (IBM Cost of a Data Breach 2025).
Put those three numbers next to your own drift window and the argument makes itself. The point is not that annual testing is worthless. It is that annual testing alone leaves an expensive, well-understood gap, and continuous testing is the control designed to close it.
Where Stingrai fits: continuous coverage from a CREST-accredited firm
Stingrai delivers continuous penetration testing as a service, backed by a firm-level CREST accreditation as a Penetration Testing service provider and a team carrying OSCE3, OSCP, OSWE, CREST CRT, and CISSP certifications. The model is built specifically to close the drift window.
Stingrai's autonomous web-application agent, Snipe, is purpose-built to hunt the complex classes that survive between annual tests: IDOR, business-logic flaws, and broken-authorization bugs, not just known-class findings. Snipe runs black-box dynamic testing and white-box source-code review, generates AutoFix pull requests for what it finds, and can run as a PR-gating check on every pull request, so vulnerable code is caught before it merges rather than months later. It is custom-trained on more than 6,000 HackerOne Hacktivity disclosure reports plus skills distilled from years of Stingrai's human pentesters' methodology, so it encodes how senior testers actually find these bugs. Senior pentesters then validate and extend the high-severity findings.
The result is the coverage story your board wants: continuous PTaaS that re-tests on every change and gates pull requests, so a missed IDOR or business-logic flaw never lives untested through the drift window, combined with the depth of a CREST-accredited offensive-security firm. For the annual, deep-dive human engagements that anchor the program, Stingrai's web-application penetration testing and red-teaming services provide the periodic full-scope assurance that continuous testing then keeps fresh between engagements. Packages and current pricing are on the Stingrai pricing page.
If you want the deeper comparison of cadences, we cover it in continuous red teaming versus the annual pentest, continuous PTaaS explained, and continuous pentesting versus PTaaS.
A one-page board summary template
Boards decide in one page. Use this structure verbatim and fill in your own figures. Keep it to a single slide or a single sheet.
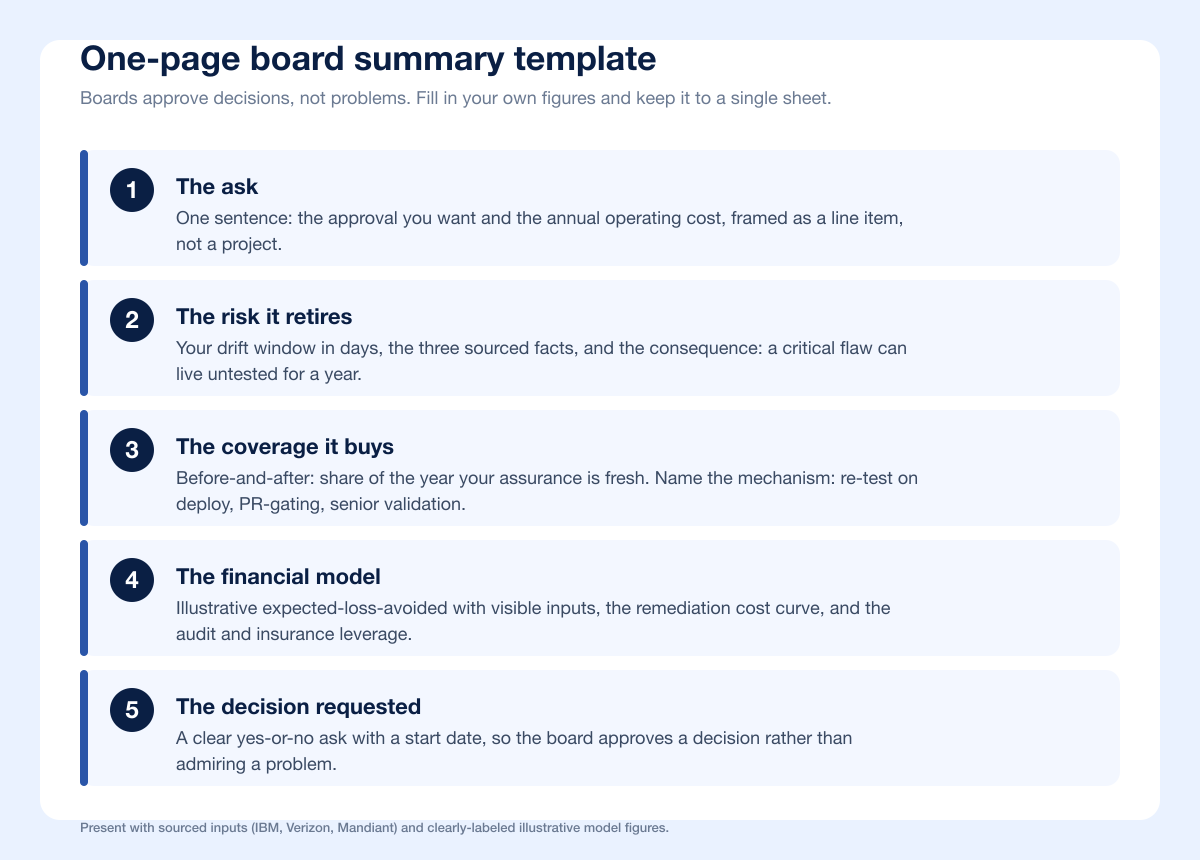
1. The ask. One sentence: the approval you want and the annual operating cost, framed as a line item, not a project.
2. The risk it retires. The drift window in days for your organization, the three sourced facts (5-day weaponization, 34% growth in exploitation, 241-day detection), and the one-line consequence: a critical flaw can live untested from one annual test to the next.
3. The coverage it buys. The before-and-after coverage metric: percentage of the year your assurance is fresh under annual testing versus continuous testing. Name the mechanism: re-test on deployment, PR-gating, senior validation.
4. The financial model. The illustrative expected-loss-avoided figure with every input visible and sourced, plus the remediation-cost-curve point (catch at PR time versus after a breach), plus the audit and insurance leverage.
5. The decision requested. A clear yes-or-no ask with a start date, so the board is approving a decision, not admiring a problem.
The tone that works with a board is calm and quantified. You are not selling fear. You are presenting a well-understood exposure, a control that closes it, and a conservative model that shows the control costs less than the exposure. That is a decision a CFO can defend to an audit committee.
What this means for security leaders
Lead with the drift window, not the tool. The budget case is about coverage that tracks change, not about buying more of the same test.
Anchor impact to third-party benchmarks. Use IBM, Verizon, and Mandiant figures for credibility, and label your own model inputs as illustrative.
Show the remediation cost curve. Catching a flaw at pull-request time is the cheapest point on the curve; a breach is the most expensive.
Bundle the audit and insurance leverage. Continuous evidence supports SOC 2, ISO 27001, PCI DSS 4.0, and DORA programs and strengthens your insurance position.
Bring the one-page summary. Boards approve decisions, not problems. Give them the ask, the risk, the coverage, the model, and a clear yes-or-no.
Frequently Asked Questions
How do I build the business case for continuous penetration testing and justify the budget to my CFO and board?
Build it on the drift window: the days between annual tests where new code ships and new vulnerabilities get weaponized while your last report goes stale. Quantify that gap, attach an illustrative loss figure anchored to a benchmark like the US$4.44M average breach cost (IBM Cost of a Data Breach 2025), and present continuous testing as coverage that tracks change rather than a bigger version of the annual test. Finish with a one-page summary that states the ask, the risk retired, the coverage bought, and a clear decision.
What is the cost of a missed vulnerability between annual tests?
It depends on the flaw and your environment, so model it as a range with clearly-labeled illustrative inputs. The key benchmark is that the global average data breach costs US$4.44M and takes a mean of 241 days to identify and contain (IBM Cost of a Data Breach 2025). A flaw caught at pull-request time by continuous testing is a small, predictable line item; the same flaw exploited during the drift window is a large, uncertain tail cost.
How fast do attackers exploit new vulnerabilities?
The median time to weaponize a newly disclosed vulnerability fell to 5 days, down from 32 days the year prior, according to Mandiant's M-Trends 2025 report (Google Cloud, published April 2025). Because exploitation now takes days, an annual testing cadence leaves roughly 360 days of unverified change, which is the core of the drift-window argument.
What is the ROI of continuous pentesting?
Measure ROI as expected loss avoided per dollar of cost, across four parts: the exposure you retire by shrinking the drift window, the coverage you buy by tracking change instead of testing once, the remediation cost you save by catching flaws at pull-request time, and the audit and cyber-insurance leverage continuous evidence provides. Keep every model input visible and conservative so finance can stress-test it.
Does continuous testing replace the annual penetration test?
No. Continuous testing and periodic deep-dive human engagements are complementary. The annual, full-scope test anchors the program and provides the deepest human-led assurance; continuous testing keeps that assurance fresh between engagements by re-testing on every deployment and gating pull requests. The budget case is for adding continuous coverage on top of, not instead of, the periodic engagement.
What kinds of vulnerabilities are most likely to survive between annual tests?
Complex, high-impact classes: IDOR, broken authorization, and business-logic flaws that depend on how your specific application handles identity, state, and access. These require reasoning about intended behavior, so signature scanners miss them, and they accumulate silently as you ship new code. A continuous testing capability that can actually reach these classes, such as Stingrai's Snipe agent, is what makes the coverage meaningful.
How does continuous penetration testing help with compliance and cyber insurance?
A continuous stream of tested-and-remediated findings provides ongoing evidence that supports SOC 2, ISO 27001, PCI DSS 4.0, NIST, and DORA programs, and demonstrates the proactive control posture cyber-insurers reward. Stingrai's penetration testing supports your compliance program by providing the pentest evidence your audits require, and continuous coverage keeps that evidence current between annual reviews.
Where can I get the latest data breach and exploitation statistics?
Use the primary publishers directly: the IBM Cost of a Data Breach Report for breach cost and lifecycle figures, the Verizon Data Breach Investigations Report for initial-access-vector trends, and Mandiant's M-Trends report for dwell time and time-to-exploit. All three are cited with links in the references below so any figure in this post can be audited at its source.
References
IBM. Cost of a Data Breach Report 2025. Published 2025. https://www.ibm.com/reports/data-breach. Global average breach cost of US$4.44M (down 9% year over year) and a mean 241-day breach lifecycle to identify and contain, based on a study of hundreds of breached organizations.
Verizon. 2025 Data Breach Investigations Report (DBIR). Published April 23, 2025. https://www.verizon.com/business/resources/reports/dbir/. Analyzed 22,052 incidents and 12,195 confirmed breaches; vulnerability exploitation rose to 20% of breaches, up 34% year over year, with only 54% of edge and VPN vulnerabilities fully remediated at a median 32 days.
Mandiant (Google Cloud). M-Trends 2025. Published April 23, 2025. https://cloud.google.com/blog/topics/threat-intelligence/m-trends-2025/. Global median dwell time of 11 days; exploits the top initial infection vector at 33%; median time to weaponize a disclosed vulnerability fell to 5 days from 32 the prior year.