Manufacturing held the #1 most-attacked industry slot for the fourth consecutive year. IBM's X-Force Threat Intelligence Index 2025 found that Manufacturing absorbed 26% of all incidents X-Force responded to in 2024, with extortion driving 29% of those impacts and data theft another 24%. Verizon's 2025 Data Breach Investigations Report confirmed the picture from a different corpus: Manufacturing logged 3,807 incidents and 1,607 confirmed breaches, nearly double the 849 from a year earlier. NCC Group's Annual Cyber Threat Intelligence 2025 counted 7,874 ransomware attacks across all sectors in 2025, a 50% YoY rise, with Industrials taking 28% of leak-site posts. Cisco Talos's 2025 Year in Review flagged Manufacturing as the most-targeted ransomware sector, citing the Qilin RaaS operator's pace of more than 40 leak-site postings per month. The economics are clear: attackers prioritize sectors with the lowest tolerance for downtime and the deepest mix of IT and OT systems, and Manufacturing tops both lists.
Three forces drove the 2025-2026 industry picture. Healthcare cost dominance. IBM's 2025 Cost of a Data Breach Report priced the average healthcare breach at US$7.42M, the highest of any industry for the 14th consecutive year, with a 279-day mean time to identify and contain. Financial Services breach-volume leadership. Verizon's 2025 DBIR called Financial Services the most-breached industry for the first time since 2018, with financial institutions accounting for 27% of major breaches, and Mandiant's M-Trends 2025 put Financial Services at 17.4% of its 2024 investigation pool, the largest share. Critical-infrastructure concentration. IBM X-Force found that 70% of the attacks it responded to in 2024 hit a critical-infrastructure operator, reinforcing the view that adversaries deliberately concentrate on Manufacturing, Energy, Transportation, Finance, and Healthcare because operational pressure shortens negotiations and increases the likelihood of payment. The data is for CISOs, security buyers, board risk committees, and journalists building 2026 budget cases.
This post is the Stingrai research team's canonical 2026 reference for industry targeting. It assembles 90+ numeric claims from 18 named primary publishers, including IBM X-Force, Verizon, IBM Cost of a Data Breach, Mandiant M-Trends (Google Cloud), Microsoft Digital Defense Report, Sophos State of Ransomware, NCC Group Annual Cyber Threat Intelligence, Coveware (now Veeam), Cisco Talos, ENISA Threat Landscape, ITRC Annual Data Breach Report, FBI IC3, HHS OCR Breach Portal, HIPAA Journal, BitSight TRACE, Forescout Vedere Labs, Comparitech, and K12 SIX. Lead data is full-year 2024 and 2025 telemetry, the freshest available; primary publishers have not yet released full-year 2026 reports as of April 2026. Every figure carries its source, year, and methodology window, and every link points back to the primary publisher so any claim can be audited inline.
TL;DR: 11 labeled key stats
Most-attacked industry (IBM X-Force, 2024 data): Manufacturing at 26% of incidents, the fourth consecutive year as #1 (IBM X-Force Threat Intelligence Index 2025).
Most-breached industry (Verizon, 2025 DBIR): Financial Services overtook Healthcare for the first time since 2018, accounting for 27% of major breaches (Verizon 2025 DBIR).
Highest breach cost (IBM, 2025): Healthcare at US$7.42M, 14 consecutive years as #1, 279-day containment time (IBM Cost of a Data Breach 2025).
Most Mandiant investigations (2024 data): Financial Services at 17.4% of cases, ahead of Business and Professional Services 11.1%, High Tech 10.6%, Government 9.5%, Healthcare 9.3% (Mandiant M-Trends 2025).
Ransomware sector leader (NCC Group, 2025): Industrials at 28% of leak-site activity (2,190 attacks, +54% YoY), Consumer Discretionary 22% (1,774 attacks) (NCC Group Annual CTI 2025).
Coveware ransomware caseload (Q2 2025): Professional Services 19.7%, Consumer Services 13.7%, Healthcare 13.7%, Public Sector 9.4%, Financial Services 7.7% (Coveware Q2 2025).
Critical infrastructure share (IBM, 2024): 70% of all X-Force engagements involved a critical-infrastructure operator (IBM X-Force 2025).
Healthcare records exposed (HHS OCR): 289,162,330 in 2024 (record); 61,556,256 in 2025 (-78.7% YoY) (HIPAA Journal 2025 healthcare breach report).
ITRC most-breached industry (2025): Financial Services 739 compromises, Healthcare 534, Professional Services 478, Manufacturing 299, Education 188 (ITRC 2025 Annual Data Breach Report).
EU most-targeted sector (ENISA, Jul 2024 to Jun 2025): Public Administration at 38.2% of 4,875 incidents, Transport 7.5%, Digital Infrastructure 4.8%, Finance 4.5% (ENISA Threat Landscape 2025).
Top motivation (Microsoft, 2025): Over 52% extortion and ransomware vs only 4% espionage; data theft was the goal in 80% of incidents (Microsoft Digital Defense Report 2025).
Key takeaways
Three independently-collected datasets agree that Manufacturing is the single most-attacked industry in 2024-2025. IBM X-Force counts 26% of incidents; Verizon DBIR counts 1,607 confirmed breaches (nearly double the prior year); NCC Group counts 28% of ransomware leak-site activity; Cisco Talos and BitSight TRACE both name Manufacturing as the year's #1 ransomware target. The agreement across telemetry, incident-response, and leak-site-tracking sources rules out a single-vendor artifact.
Healthcare and Financial Services swap places depending on what you measure. Healthcare leads breach cost (US$7.42M for the 14th year per IBM 2025) and patient-impact volume (192.7M from Change Healthcare alone). Financial Services leads breach count (27% of major breaches per Verizon 2025 DBIR), Mandiant investigation volume (17.4% per M-Trends 2025), and ITRC sector compromises (739 in 2025).
Professional Services has emerged as the new ransomware caseload leader in 2025. Coveware's Q2 2025 marketplace report put Professional Services at 19.7% of ransomware engagements, ahead of Consumer Services and Healthcare at 13.7% each. ITRC also flagged Professional Services as the industry with the largest growth in attacks during 2025, framing it as a stepping-stone for downstream-client compromise.
Critical-infrastructure concentration is the structural story of 2024-2025. IBM X-Force's finding that 70% of incidents involved critical infrastructure, combined with Forescout Vedere Labs's 84% YoY surge in attacks using OT protocols and Volt Typhoon's continued embedding in US electric, oil, and gas networks, tells one coherent story. Adversaries follow operational pressure, and operational pressure is highest where downtime translates directly into financial or social cost.
Espionage-motivated breach activity is rising in two unexpected sectors: Healthcare and Manufacturing. Verizon's 2025 DBIR reports the espionage motive jumping from 1% to 16% of healthcare breaches and from 3% to 20% of manufacturing breaches in a single year. The pattern suggests sustained interest from nation-state operators in IP theft, supply-chain positioning, and biotech research, layered on top of the dominant financially-motivated activity Microsoft documented at 52% of all motivated attacks.
Methodology
Sources used: IBM X-Force Threat Intelligence Index 2025 (CY2024 data, April 2025 release); Verizon 2025 Data Breach Investigations Report (Nov 1 2023 to Oct 31 2024 collection window, 22,052 incidents and 12,195 confirmed breaches, May 2025 release); IBM 2025 Cost of a Data Breach Report (over 600 organizations across 17 industries, August 2025 release, Ponemon-aligned methodology); Mandiant M-Trends 2025 (Jan 1 2024 to Dec 31 2024, 450,000+ Mandiant Consulting investigation hours, April 2025 release); Microsoft Digital Defense Report 2025 (July 2024 to June 2025 coverage, October 2025 release); Sophos State of Ransomware 2025 (n=3,400 across 17 countries, June 2025 release); Sophos State of Ransomware in Manufacturing and Production 2025 (December 2025); Sophos State of Ransomware in Retail 2025; Sophos State of Ransomware in Healthcare 2025 (n=292, October 2025); NCC Group Annual Cyber Threat Intelligence 2025 (CY2025 ransomware leak-site tracking, January 2026); NCC Group monthly threat pulses for September, October, November, and December 2025; Coveware Q2 2025 Ransomware Marketplace Report (July 2025); Coveware Q4 2024; Cisco Talos 2025 Year in Review (April 2026 release); ENISA Threat Landscape 2025 (July 1 2024 to June 30 2025, 4,875 incidents, October 2025 release); CrowdStrike 2025 Global Threat Report (CY2024 data, February 2025 release); ITRC 2025 Annual Data Breach Report (January 2026 release); HHS OCR Breach Portal (continuous, snapshots from January 2025 and post-June 2025); HIPAA Journal monthly and annual healthcare data breach analyses; FBI IC3 2024 Internet Crime Report (April 2025 release, 859,532 complaints); BitSight TRACE 2025 State of the Underground; Forescout Vedere Labs 2025 Threat Roundup (January 2026); Comparitech Education Ransomware Roundup (Q1-Q3 2025 and full-year 2025); K12 SIX Annual K-12 Cybersecurity Report; CIS MS-ISAC 2025 K-12 State of Cybersecurity Report (Jul 2023 to Dec 2024, 5,000+ K-12 organizations); Trustwave 2025 SpiderLabs energy and utilities report; Cyfirma energy-sector ransomware tracking; Cloud Security Alliance on the Snowflake breach.
Date cutoff: April 25, 2026. Lead data is full-year 2024 or 2025 telemetry where a primary publisher has released it. No 2026 retrospective stats appear because no primary publisher has released a credible full-year 2026 report yet. Statistics that could not be reached on at least one verification pass against a named primary source were dropped rather than estimated. Where two named publishers report different values for the same metric (a normal occurrence given different corpora and definitions), both numbers are presented inline with their attribution. Aggregator articles, vendor blogs, and AI-generated summaries are cited only where they constitute the public record of an event the primary source has not republished directly.
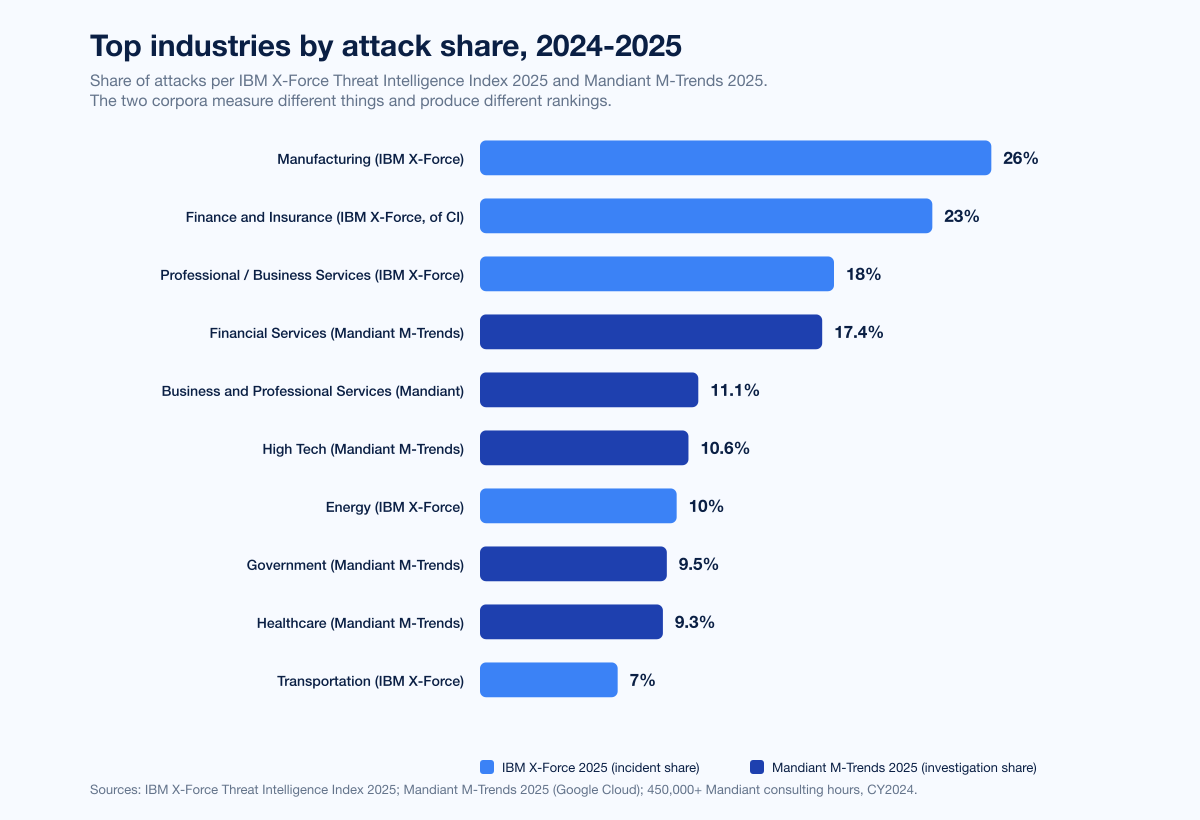
Figure 1: Top industries by attack share in 2024-2025 across two primary publishers. IBM X-Force Threat Intelligence Index 2025 ranks Manufacturing 26%, Finance and Insurance 23%, Professional/Business/Consumer Services 18%, Energy 10%, Transportation 7%. Mandiant M-Trends 2025 ranks Financial Services 17.4%, Business and Professional Services 11.1%, High Tech 10.6%, Government 9.5%, Healthcare 9.3%. Sources: IBM X-Force Threat Intelligence Index 2025; Mandiant M-Trends 2025.
How the rankings work
Three independent telemetry datasets define the 2025-2026 industry picture. Each uses a different lens and produces a different ranking, which is precisely why combining them gives the truest answer.
IBM X-Force Threat Intelligence Index 2025
The IBM X-Force Threat Intelligence Index 2025 draws on incident-response engagements and threat-intelligence telemetry across X-Force's global customer base. The 2025 edition reports calendar year 2024 data.
Industry | 2024 share of incidents | Source |
|---|---|---|
Manufacturing | 26% (4th consecutive year as #1) | IBM X-Force 2025 |
Finance and Insurance | 23% of critical-infrastructure attacks | IBM X-Force 2025 |
Professional, Business and Consumer Services | 18% | IBM X-Force 2025 |
Energy | 10% | IBM X-Force 2025 |
Transportation | 7% | IBM X-Force 2025 |
The structural story across IBM X-Force's 2024 data: 70% of all engagements involved a critical-infrastructure operator. Manufacturing's 26% share is unusual not just because of its size but because of its persistence. Manufacturing was #1 in the 2022, 2023, 2024, and 2025 editions of the Index. Within Manufacturing impact types, extortion drove 29% of cases and data theft another 24%, which IBM attributes to financial-asset and intellectual-property targeting.
Verizon 2025 Data Breach Investigations Report
The Verizon 2025 DBIR, the canonical reference for breach-vector and pattern analysis, analyzed 22,052 incidents and 12,195 confirmed breaches between November 1, 2023 and October 31, 2024.
Industry | 2025 DBIR incidents | 2025 DBIR confirmed breaches | Source |
|---|---|---|---|
Manufacturing | 3,807 | 1,607 (up from 849 prior year) | Verizon 2025 DBIR |
Healthcare | 1,702 | 1,542 | Verizon 2025 DBIR |
Financial Services | (most-breached for the first time since 2018; 27% of major breaches) | (same) | Verizon 2025 DBIR |
Three sector-specific findings stand out from the 2025 DBIR. First, Manufacturing's espionage-motivated breaches jumped to 20% from 3%, a near-sixfold rise. Second, Healthcare's espionage motive rose from 1% in 2023 to 16% in 2024. Third, Financial Services overtook Healthcare as the most-breached industry, accounting for 27% of major breaches in the 2025 DBIR. Across all sectors, ransomware appeared in 44% of confirmed breaches (up from 32%), third-party involvement doubled to 30%, and vulnerability exploitation rose 34% YoY.
Mandiant M-Trends 2025
Mandiant M-Trends 2025 analyzed more than 450,000 hours of consulting investigations between January 1, 2024 and December 31, 2024.
Industry | 2024 share of Mandiant investigations | Source |
|---|---|---|
Financial Services | 17.4% (most-targeted) | Mandiant M-Trends 2025 |
Business and Professional Services | 11.1% | Mandiant M-Trends 2025 |
High Tech | 10.6% | Mandiant M-Trends 2025 |
Government | 9.5% | Mandiant M-Trends 2025 |
Healthcare | 9.3% | Mandiant M-Trends 2025 |
Mandiant's headline metrics across all sectors are equally informative. Global median dwell time was 11 days, up from 10 in 2023. Adversary-notified discovery (most often via ransomware notes) ran at a 5-day median. External-notified discovery ran at a 26-day median. Initial infection vectors: exploits 33% (most common), stolen credentials 16% (second highest, the first time stolen credentials reached this rank in M-Trends history). Threat-actor motivation: 55% financially motivated, 8% espionage.
Why the three datasets disagree
IBM X-Force's 26% Manufacturing share, Verizon DBIR's 27% Financial Services share, and Mandiant's 17.4% Financial Services share are not contradictions; they reflect different counting bases.
IBM X-Force counts incidents (including unsuccessful attempts and active engagements). Manufacturing's reliance on hot OT environments and brittle IT/OT integration produces a high incident count.
Verizon DBIR counts confirmed data breaches. Financial Services has more confirmed breaches because its regulatory disclosure pipeline (SEC, banking regulators, state data-breach laws) catches more compromises and confirms them faster.
Mandiant M-Trends counts investigation engagements. Financial Services contracts more incident-response retainers because its risk officers' regulatory exposure to confirmed breaches is the highest of any sector.
A defender reading all three should conclude that Manufacturing is the most attacked, Financial Services is the most confirmed-breached, and Healthcare is the most expensive. The three sectors are the canonical 2026 buyer-priority list.
How much does a breach cost by industry?
IBM's 2025 Cost of a Data Breach Report priced the average data breach at US$4.44M globally in 2025, down 9% YoY, but the United States average reached a record US$10.22M, up from US$9.36M in 2024.
Industry | 2025 average breach cost | Source |
|---|---|---|
Healthcare | US$7.42M (-24% YoY from US$9.77M; #1 for 14 consecutive years; 279-day containment) | IBM 2025 |
Financial Services | US$5.56M | IBM 2025 |
Industrial | US$5.00M | IBM 2025 |
Energy | US$4.83M | IBM 2025 |
Technology | US$4.79M | IBM 2025 |
Pharmaceuticals | US$4.61M | IBM 2025 |
The industry rankings inside IBM Cost of a Data Breach are arguably the cleanest single source for sector-by-sector economic impact. Healthcare's 14-year reign as the most expensive sector is structural: HIPAA penalties, regulatory remediation, brand damage, the value of PHI on dark-web markets, the cost of medical-device vulnerabilities, and the 279-day average detection window all compound. Even Healthcare's 2025 cost of US$7.42M, despite the 24% YoY drop from a 2024 figure inflated by Change Healthcare, is well above the global average.
Public sector breaches saw the largest YoY cost increase at +10.8% (US$310K added per breach), which IBM attributes to the rising cost of government-grade incident response and the growing regulatory exposure of municipalities. Phishing-initiated breaches averaged US$4.8M and accounted for 16% of breaches in IBM's 2025 cut. Compromised-credential breaches averaged US$4.67M with a 246-day mean time to identify and contain. Shadow-AI breaches averaged US$4.63M, US$670K above standard incidents.
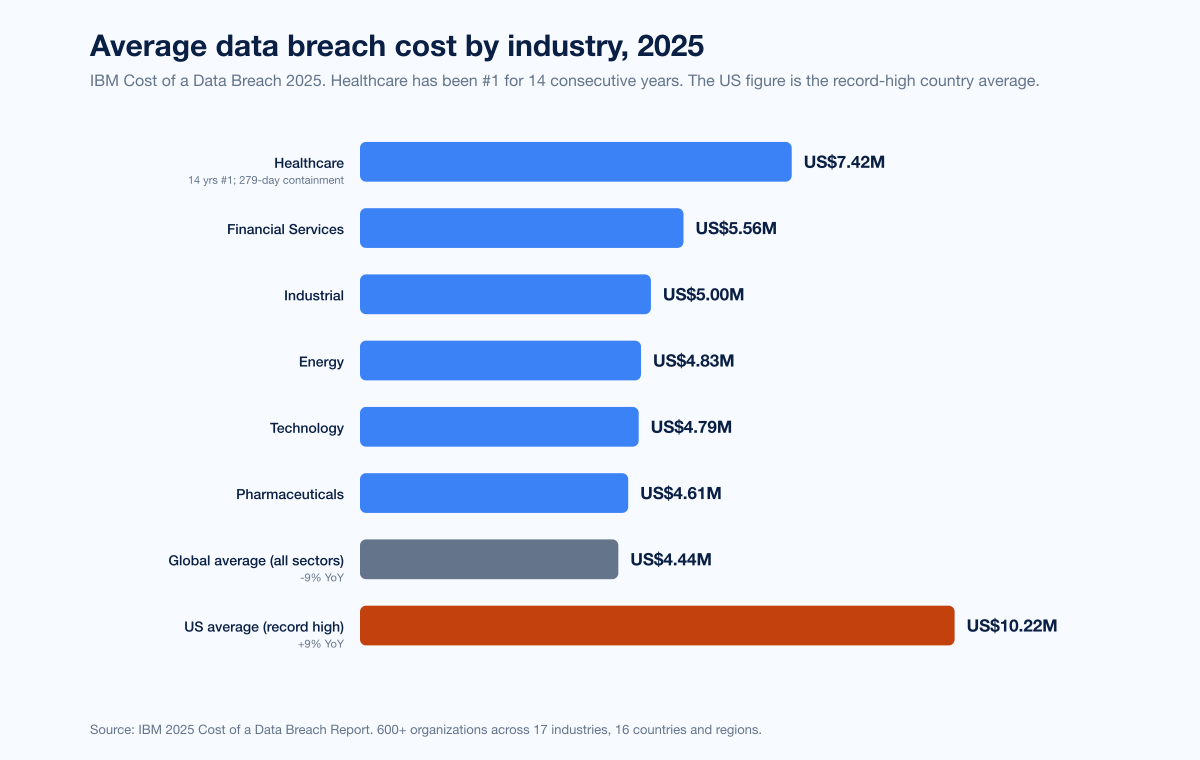
Figure 2: Average data breach cost by industry per IBM Cost of a Data Breach 2025. Healthcare US$7.42M (14 consecutive years as the most expensive sector); Financial Services US$5.56M; Industrial US$5.00M; Energy US$4.83M; Technology US$4.79M; Pharmaceuticals US$4.61M. Global average US$4.44M (down 9% YoY); US average US$10.22M (record high). Source: IBM 2025 Cost of a Data Breach Report.
Manufacturing deep-dive: why it stays #1
Manufacturing has held the #1 attack-share slot in IBM X-Force's ranking for four consecutive years (2022, 2023, 2024, 2025 editions). Two structural facts explain the persistence.
First, Manufacturing has the lowest tolerance for downtime in any sector. A pharmaceutical packaging line, a semiconductor fab, an automotive assembly plant, or a food-and-beverage pasteurization line cannot pause for incident response without immediate cash-flow consequences. Cisco Talos's 2025 Year in Review explicitly attributed Manufacturing's #1-ransomware-target status to "low tolerance for downtime and complex hybrid (IT/OT) environments." NCC Group's December 2025 monthly pulse documented that Industrials accounted for 29% of December attacks, and the October pulse put Industrials at 30% in Q3 2025.
Second, Manufacturing's IT/OT convergence has created a wider attack surface than any pure-IT industry. Forescout Vedere Labs reviewed more than 900 million attacks globally between January and December 2025 and reported attacks using OT protocols up 84% YoY, led by Modbus, Ethernet/IP, and BACnet, with Manufacturing among the leading targets.
Manufacturing metric | Value | Source |
|---|---|---|
IBM X-Force attack share | 26% (4th consecutive year as #1) | IBM X-Force 2025 |
Verizon 2025 DBIR confirmed breaches | 1,607 (up from 849 prior year) | Verizon 2025 DBIR |
Verizon 2025 DBIR incidents | 3,807 | Verizon 2025 DBIR |
NCC Group 2025 ransomware leak-site share | 28% (Industrials, 2,190 attacks; +54% YoY) | NCC Group 2025 |
Verizon 2025 DBIR espionage motive | 20% (up from 3% in 2023) | Verizon 2025 DBIR |
IBM X-Force impact: extortion | 29% | IBM X-Force 2025 |
IBM X-Force impact: data theft | 24% | IBM X-Force 2025 |
Sophos 2025 root cause: exploited vulnerabilities | 32% | |
Sophos 2025 root cause: malicious emails | 23% (down from 29% in 2024) | Sophos 2025 |
Sophos 2025 encryption rate | 40% (5-year low) | Sophos 2025 |
Sophos 2025 data-theft + encryption rate | 39% | Sophos 2025 |
The Sophos 2025 manufacturing report is the most-detailed sector view available. The 5-year low in encryption rates does not mean fewer breaches; it means attackers have shifted from encryption-only to data-theft-plus-extortion or extortion-only models, which produce ransom payments without the operational signature of ransomware.
Cisco Talos noted that the Qilin ransomware group published victim information at a rate exceeding 40 cases per month in 2025, with the manufacturing sector the most-targeted. NCC Group recorded Qilin as the top threat actor of 2025 with 1,022 attacks (13% share), followed by Akira at 755 attacks and CL0P at 517 attacks.
Healthcare deep-dive: highest cost, biggest single breach
Healthcare carried the highest per-breach cost for the 14th consecutive year per IBM's 2025 Cost of a Data Breach Report and absorbed the single largest healthcare data breach in US history during 2024.
Healthcare metric | Value | Source |
|---|---|---|
IBM 2025 average cost | US$7.42M (14-year #1; -24% YoY from US$9.77M) | IBM Cost of a Data Breach 2025 |
Healthcare containment time | 279 days | IBM 2025 |
HHS OCR breaches affecting 500+ records, 2024 | 725 (Jan 2025 snapshot) to 742 (later revisions) | |
HHS OCR breaches, 2025 | 642 (-13.5% YoY) | |
Individuals affected, 2024 | 289,162,330 (record) | HHS OCR |
Individuals affected, 2025 | 61,556,256 (-78.7% YoY) | HHS OCR |
Verizon 2025 DBIR healthcare incidents | 1,702 | Verizon 2025 DBIR |
Verizon 2025 DBIR healthcare confirmed breaches | 1,542 | Verizon 2025 DBIR |
Verizon 2025 DBIR healthcare espionage motive | 16% (up from 1% in 2023) | Verizon 2025 DBIR |
Sophos 2025 healthcare encryption rate | 34% (5-year low; down from 74% in 2024) | |
Sophos 2025 healthcare ransom payment rate | 36% (down from 61% in 2022) | Sophos 2025 |
Sophos 2025 healthcare median ransom paid | US$150K (lowest of any sector) | Sophos 2025 |
Sophos 2025 healthcare mean recovery cost | US$1.02M (-60% YoY from US$2.57M) | Sophos 2025 |
The single most consequential healthcare breach of the past two years was the Change Healthcare ransomware attack on February 21, 2024, conducted by ALPHV/BlackCat. UnitedHealth's subsidiary Change Healthcare disclosed approximately 192.7 million affected individuals as of July 31, 2025. The attack used stolen credentials against a Citrix portal that had not been configured with multi-factor authentication. UnitedHealth has estimated the total cost at over US$1.5 billion. CEO Andrew Witty confirmed the company paid approximately US$22 million in ransom but did not get the data back.
Healthcare's economics are reshaping under attacker pressure. The 91% drop in median ransom demand from US$4M (2024) to US$343K (2025) and the 60% drop in mean recovery cost reflect both attackers tuning down demands when payment rates fall and providers building better backup and segmentation. The Sophos 12% extortion-only share for 2025 is the highest yet recorded in the sector and confirms that data-theft pressure has displaced encryption as the dominant ransomware playbook in Healthcare.
Financial Services deep-dive: most-breached industry
Financial Services overtook Healthcare in Verizon's 2025 DBIR for confirmed-breach volume, and Mandiant's M-Trends 2025 ranked it as the largest single industry of investigation engagements. ITRC's 2025 Annual Data Breach Report confirmed the trend with Financial Services as the most-breached industry across all 2025 disclosures.
Financial Services metric | Value | Source |
|---|---|---|
Verizon 2025 DBIR major-breach share | 27% | Verizon 2025 DBIR |
Mandiant M-Trends 2025 investigation share | 17.4% (most-investigated industry) | |
ITRC 2025 compromises | 739 (most-compromised sector) | |
IBM 2025 average breach cost | US$5.56M (#2 highest, behind Healthcare) | IBM 2025 |
CrowdStrike 2024 China-nexus state activity targeting financial services | up to +300% | |
ENISA 2025 share | 4.5% | |
Coveware Q2 2025 ransomware caseload | 7.7% |
Why does Financial Services lead breach counts but not breach cost? Two reasons. First, the sector's regulatory disclosure pipeline is the most aggressive of any industry. SEC Form 8-K cyber-incident disclosure rules (effective late 2023), state banking regulators, and FFIEC examination processes catch and confirm a higher proportion of compromises than HIPAA does for Healthcare. Second, mature breach-detection telemetry inside Financial Services compresses the cost of a breach: better SOC tooling, faster IR retainers, and stronger backup hygiene all reduce the per-breach financial impact. The same maturity that makes Financial Services more confirmed-breach-dense also makes its average cost lower than Healthcare's despite a comparable threat-actor focus.
Top sectors for ransomware specifically
Ransomware ranking by sector depends heavily on which lens you use: leak-site posts, IR caseload, or insurance claims. We present the three most-cited datasets.
NCC Group 2025: leak-site activity
NCC Group's Annual Cyber Threat Intelligence 2025 tracked leak-site postings from active ransomware groups across the year.
Sector | Share | 2025 attack count | Source |
|---|---|---|---|
Industrials | 28% | 2,190 (+54% YoY) | NCC Group 2025 |
Consumer Discretionary | 22% | 1,774 | NCC Group 2025 |
Information Technology | 10% (December figure) | (proportional) | NCC Group Dec 2025 |
(Other sectors) | 39% combined | (balance) | NCC Group 2025 |
Total NCC Group 2025 ransomware leak-site attacks: 7,874, a 50% increase YoY.
Coveware Q2 2025: incident-response caseload
Coveware's Q2 2025 marketplace report measures cases handled by Coveware's IR-and-negotiation arm, weighted toward mid-market North American organizations.
Sector | Q2 2025 caseload share | Source |
|---|---|---|
Professional Services | 19.7% | Coveware Q2 2025 |
Consumer Services | 13.7% | Coveware Q2 2025 |
Healthcare | 13.7% | Coveware Q2 2025 |
Public Sector | 9.4% | Coveware Q2 2025 |
Financial Services | 7.7% | Coveware Q2 2025 |
Coveware's Q2 2025 also reported the average ransom payment at US$1,130,070 (up 104% from Q1 2025) and exfiltration appearing in 74% of cases. In Q1 2025, Healthcare led at 15.4% with Professional Services at 14.4%; the swap by Q2 reflects the late-2025 surge in supply-chain compromise of professional-services firms used as stepping-stones to downstream clients.
Sophos State of Ransomware 2025: cross-sector survey
Sophos's 2025 cross-sector survey of 3,400 IT and cybersecurity leaders across 17 countries found:
Cross-sector metric | Value | Source |
|---|---|---|
Average ransom payment | US$1.0M | Sophos 2025 |
Average recovery cost (excluding ransom) | US$1.5M (down 44% YoY) | Sophos 2025 |
Ransom payment rate | 49% | Sophos 2025 |
Recovered encrypted data | 97% | Sophos 2025 |
Recovered within a week | 53% | Sophos 2025 |
Top root cause: exploited vulnerabilities | 32% | Sophos 2025 |
Compromised credentials root cause | 23% | Sophos 2025 |
Malicious emails root cause | 19% | Sophos 2025 |
Sophos's Retail 2025 sub-report tells the most attacker-friendly story of any sector. Retail's 58% ransom-payment rate is the highest of any sector and nearly double the 32% Retail rate from 2021. Median demand doubled to US$2M and demands above US$5M increased 59% YoY. Retailers' 45% lack-of-expertise root-cause attribution was the highest of any sector surveyed.
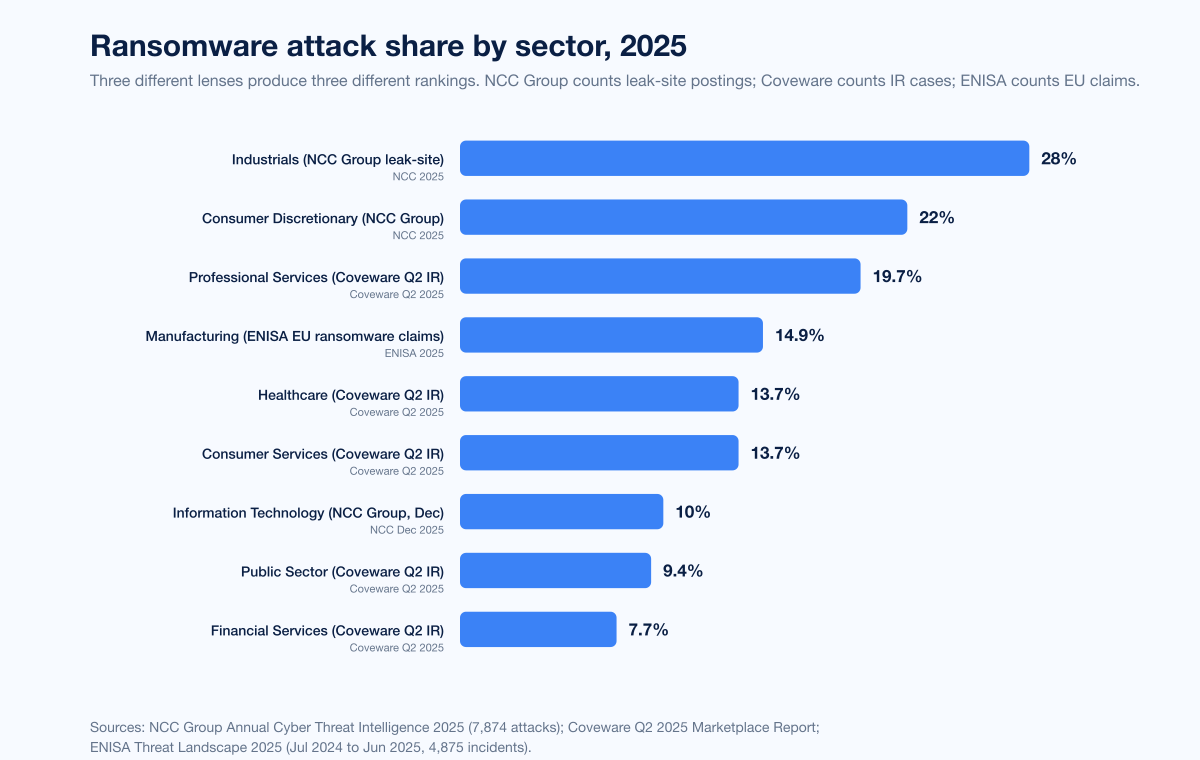
Figure 3: Ransomware attack share by sector across primary publishers in 2024-2025. NCC Group 2025 (leak-site postings, 7,874 attacks total): Industrials 28%, Consumer Discretionary 22%, IT 10% (December figure). Coveware Q2 2025 (incident-response caseload): Professional Services 19.7%, Consumer Services 13.7%, Healthcare 13.7%, Public Sector 9.4%, Financial Services 7.7%. Sources: NCC Group Annual Cyber Threat Intelligence 2025; Coveware Q2 2025 Marketplace Report.
Government and Public Administration
Government and Public Administration sit in the middle of every Western threat-intel ranking, but they top European data on cyberattacks in 2025.
Government / Public Sector metric | Value | Source |
|---|---|---|
Mandiant M-Trends 2025 investigation share | 9.5% | Mandiant M-Trends 2025 |
ENISA 2025 EU sector share | 38.2% (most-targeted EU sector) | ENISA 2025 |
ENISA Public Administration DDoS share | 94.8% | ENISA 2025 |
IBM 2025 public sector breach cost YoY change | +10.8% (US$310K added per breach, largest YoY rise of any industry) | IBM Cost of a Data Breach 2025 |
Microsoft DDR 2025 IT, government, research targeting | most-targeted nation-state sectors |
Microsoft's Digital Defense Report 2025 made the Government targeting case explicit: "Government and education institutions manage critical public services and store vast amounts of sensitive data, including personally identifiable information (PII) and authentication tokens, and operate on legacy systems that are difficult to patch and secure with small IT teams with limited incident response capabilities, making them high-value targets for both nation-state actors and financially motivated cybercriminals." The report also documented 4,647 unique research-and-academia organizations recording identity-compromise signals between December 2024 and May 2025, ahead of services (841), technology (480), and manufacturing (411).
ENISA's 38.2% Public Administration share for the EU is unusually high because it includes hacktivism-driven low-impact DDoS at scale; 94.8% of Public Administration incidents in ENISA's 2025 dataset were DDoS, much of it tied to ongoing Russian-aligned hacktivism. Outside Europe, the more representative numbers are Mandiant's 9.5% and IBM's +10.8% YoY public-sector cost rise.
Education and K-12
Education sits in every major industry-targeting ranking and has its own dedicated tracking infrastructure through K12 SIX, CIS MS-ISAC, and Comparitech.
Education metric | Value | Source |
|---|---|---|
Comparitech 2025 ransomware attacks on education | 251 (94 confirmed) | |
Comparitech 2025 records affected | 3.96M (up from 3.11M in 2024) | Comparitech 2025 |
Comparitech 2025 average ransom demand | US$464K (-33% from US$694K) | Comparitech 2025 |
Comparitech US 2025 attacks | 130 (50 confirmed; -9% YoY) | Comparitech 2025 |
ITRC 2025 Education compromises | 188 | ITRC 2025 |
K12 SIX 2024 US school district ransomware | 90+ districts, 1,600+ schools | |
CIS MS-ISAC 2025 K-12 organizations affected | 82% experienced cyber threat impact | |
CIS MS-ISAC security events Jul 2023 to Dec 2024 | 14,000 | CIS MS-ISAC 2025 |
CIS MS-ISAC confirmed cybersecurity incidents | 9,300 | CIS MS-ISAC 2025 |
The single largest education-sector incident of 2024-2025 was the PowerSchool data breach disclosed in December 2024, affecting approximately 62 million students and 9.5 million teachers. The attacker phished a subcontractor's credentials in December 2024, bypassed MFA via a token-replay vulnerability, and exfiltrated student records including names, contact information, dates of birth, and a partial set of Social Security numbers. PowerSchool reserved US$28M for breach-related expenses and is offering two years of identity protection to affected individuals.
For more on education-sector attack patterns, see Stingrai's companion research piece on Education Data Breach Statistics 2026.
Energy, Utilities, and Critical Infrastructure
Energy ranks in IBM X-Force's top five with 10% of incidents and is the canonical critical-infrastructure pressure point of the 2024-2025 threat landscape.
Energy / Utilities metric | Value | Source |
|---|---|---|
IBM X-Force 2025 attack share | 10% | IBM X-Force 2025 |
IBM 2025 Energy breach cost | US$4.83M | IBM 2025 |
Trustwave 2025 ransomware in energy/utilities YoY | +80% | |
Cyfirma 2025 energy ransomware victims | 72 (+64% over prior period) | |
Energy/oil/gas/utilities >1 month recovery rate | >50% (up from 19% in 2022) | |
Forescout Vedere Labs 2025 OT-protocol attack growth | +84% YoY (Modbus, Ethernet/IP, BACnet leading) | |
Forescout solar-power vulnerabilities high or critical severity | 80% of disclosures over 3 years |
The Energy sector's 2024-2025 story is dominated by Volt Typhoon and its closely-correlated successor cluster Voltzite, both attributed to People's Republic of China nation-state operators. Researchers warned that Volt Typhoon remained embedded in US utilities through 2025 and that some breaches may never be detected. The pattern is "living off the land" persistence inside cellular gateways and routers, with the goal of pre-positioning for future disruption rather than data theft.
Retail and E-commerce
Retail cycles up and down across leak-site rankings but consistently appears in IR caseload reporting and pays the highest ransom rate of any sector.
Retail metric | Value | Source |
|---|---|---|
Sophos 2025 retail ransom payment rate | 58% (highest of any sector; up from 32% in 2021) | |
Sophos 2025 retail median ransom demand | US$2M (doubled from US$1M in 2024) | Sophos Retail 2025 |
Sophos 2025 retail >US$5M demands | 27% (up 59% from 17% in 2024) | Sophos Retail 2025 |
Sophos 2025 retail median ransom payment | US$1M | Sophos Retail 2025 |
Sophos 2025 retail mean recovery cost | US$1.65M (-40% YoY; 3-year low) | Sophos Retail 2025 |
Sophos 2025 retail encryption rate | 48% (5-year low; down from 71% in 2023) | Sophos Retail 2025 |
Sophos 2025 retail extortion-only share | 6% (tripled from 2% in 2023) | Sophos Retail 2025 |
Sophos 2025 retail lack-of-expertise root cause | 45% (highest of any sector) | Sophos Retail 2025 |
IBM X-Force 2025 retail/wholesale share | (within Professional/Business/Consumer Services 18%) | IBM X-Force 2025 |
NCC Group 2025 Consumer Discretionary share | 22% | NCC Group 2025 |
The 2024-2025 cycle saw multiple high-profile retail compromises tied to the Snowflake credential breach, including Ticketmaster and Live Nation. Mandiant and Snowflake notified approximately 165 potentially exposed customer organizations, with attackers using infostealer-stolen credentials against accounts that lacked MFA.
Technology, SaaS, and Software
Technology and SaaS firms sit at the top of CrowdStrike's industry ranking and just below Manufacturing in IBM X-Force.
Technology / SaaS metric | Value | Source |
|---|---|---|
CrowdStrike 2025 most-targeted sector | Technology (7th consecutive year) | |
Mandiant M-Trends 2025 high-tech share | 10.6% | Mandiant M-Trends 2025 |
ITRC 2025 Professional Services compromises | 478 (largest growth of any industry) | ITRC 2025 |
IBM 2025 Tech breach cost | US$4.79M | IBM 2025 |
Cisco Talos 2025 tech sector targeting | frequent MFA spray attacks | |
BitSight TRACE 2025 most-targeted manufacturing | 3rd consecutive year (Information sector incl. telecom highly affected) |
The largest 2024-2025 technology-sector incident was the Snowflake breach affecting customers across financial services, telecom, retail, healthcare, and pharmaceuticals. The attack used credentials stolen by infostealer malware (Lumma, MetaStealer, Raccoon, RedLine, RisePro, Vidar) and worked because target Snowflake accounts lacked MFA. The Cloud Security Alliance documented the chain and concluded that "successful authentication only required a valid username and password" because MFA was not enforced.
Regional differences: where attacks land
IBM X-Force 2025 regional breakdown for 2024:
Region | 2024 share of attacks | Source |
|---|---|---|
Asia-Pacific | 34% (most-targeted region) | IBM X-Force 2025 |
North America | 24% | IBM X-Force 2025 |
Europe | 3rd | IBM X-Force 2025 |
Middle East | 10% (up from 7% in 2023) | IBM X-Force 2025 |
APAC top initial-access vectors: external remote services 45%, public-facing application exploitation 18%. Top action types: malware-ransomware 22%, recon/scanning 11%, server access 11%.
ENISA Threat Landscape 2025, the canonical EU reference, analyzed 4,875 incidents between July 1, 2024 and June 30, 2025:
EU sector | ENISA 2025 share | Source |
|---|---|---|
Public Administration | 38.2% (most-targeted EU sector; 94.8% DDoS) | ENISA 2025 |
Transport | 7.5% | ENISA 2025 |
Digital Infrastructure & Services | 4.8% | ENISA 2025 |
Finance | 4.5% | ENISA 2025 |
Manufacturing | 2.9% | ENISA 2025 |
The transatlantic difference is real and worth understanding. ENISA's high Public Administration share is a hacktivism artifact: low-impact DDoS dominates the EU dataset because Russian-aligned and Iran-aligned hacktivist groups have made DDoS-on-government a routine activity since 2022. Outside Europe, the financially-motivated criminal economy dominates, and Manufacturing rises to the top.
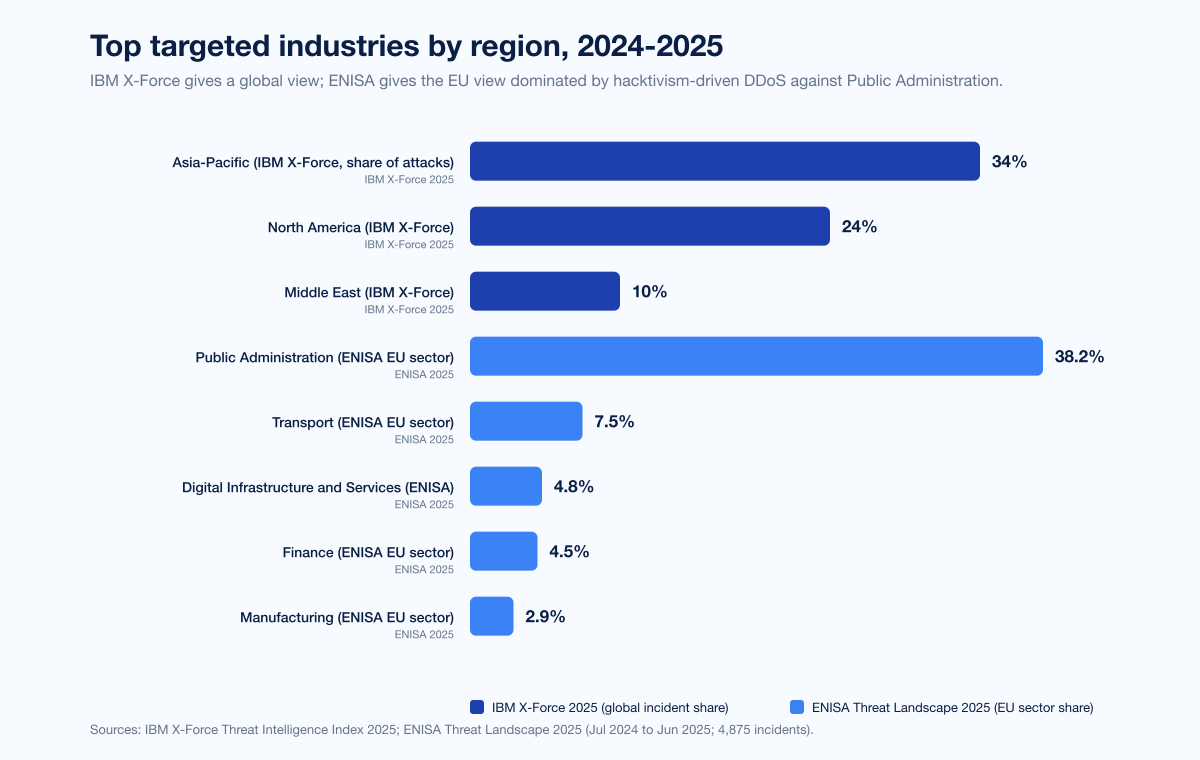
Figure 4: Regional split of attacks per primary publishers in 2024-2025. IBM X-Force Threat Intelligence Index 2025: Asia-Pacific 34%, North America 24%, Middle East 10%. ENISA Threat Landscape 2025 EU sector ranking: Public Administration 38.2%, Transport 7.5%, Digital Infrastructure 4.8%, Finance 4.5%, Manufacturing 2.9%. Sources: IBM X-Force Threat Intelligence Index 2025; ENISA Threat Landscape 2025.
Top attack patterns across sectors
Microsoft's Digital Defense Report 2025 made the cross-sector pattern explicit. Coverage period: July 2024 to June 2025.
Microsoft DDR 2025 metric | Value | Source |
|---|---|---|
Daily signals processed | over 100 trillion | Microsoft DDR 2025 |
Daily new malware blocked | 4.5 million | Microsoft DDR 2025 |
Daily identity risk detections | 38 million | Microsoft DDR 2025 |
Daily emails scanned for phishing/malware | 5 billion | Microsoft DDR 2025 |
Extortion + ransomware share of motivated attacks | over 52% | Microsoft DDR 2025 |
Espionage share of motivated attacks | 4% | Microsoft DDR 2025 |
Data-theft objective | 80% of incidents | Microsoft DDR 2025 |
Data-theft only motivation | 37% | Microsoft DDR 2025 |
Extortion component motivation | 33% | Microsoft DDR 2025 |
Ransomware or destructive motivation | 19% | Microsoft DDR 2025 |
Cloud destructive campaigns YoY | +87% | Microsoft DDR 2025 |
97% of identity attacks are password attacks | yes | Microsoft DDR 2025 |
Phishing-resistant MFA blocks of identity attacks | over 99% | Microsoft DDR 2025 |
Microsoft's 52% extortion/ransomware figure is the cleanest single answer to the question "what is the dominant motivation in 2025?" Espionage at 4% is much smaller in volume but disproportionately high in impact, since espionage targets are typically high-value (research, government, IT, defense contractors).
CrowdStrike's 2025 Global Threat Report documented an average breakout time of 48 minutes and the fastest observed breakout time of 51 seconds, with 79% of attacks in 2024 being malware-free. The implication for sector defenders: detection-and-response controls measured in hours rather than minutes are losing the race.
Cisco Talos 2025 Year in Review reported a 178% surge in device-compromise attacks (where attackers register their own hardware as a trusted MFA factor) and noted that vishing aimed at IT administrators ran at three times the rate of user-managed registration fraud. Manufacturing remained the most-targeted ransomware sector; Higher Education was the most-targeted device-compromise sector due to its diverse, unmanaged device environment.
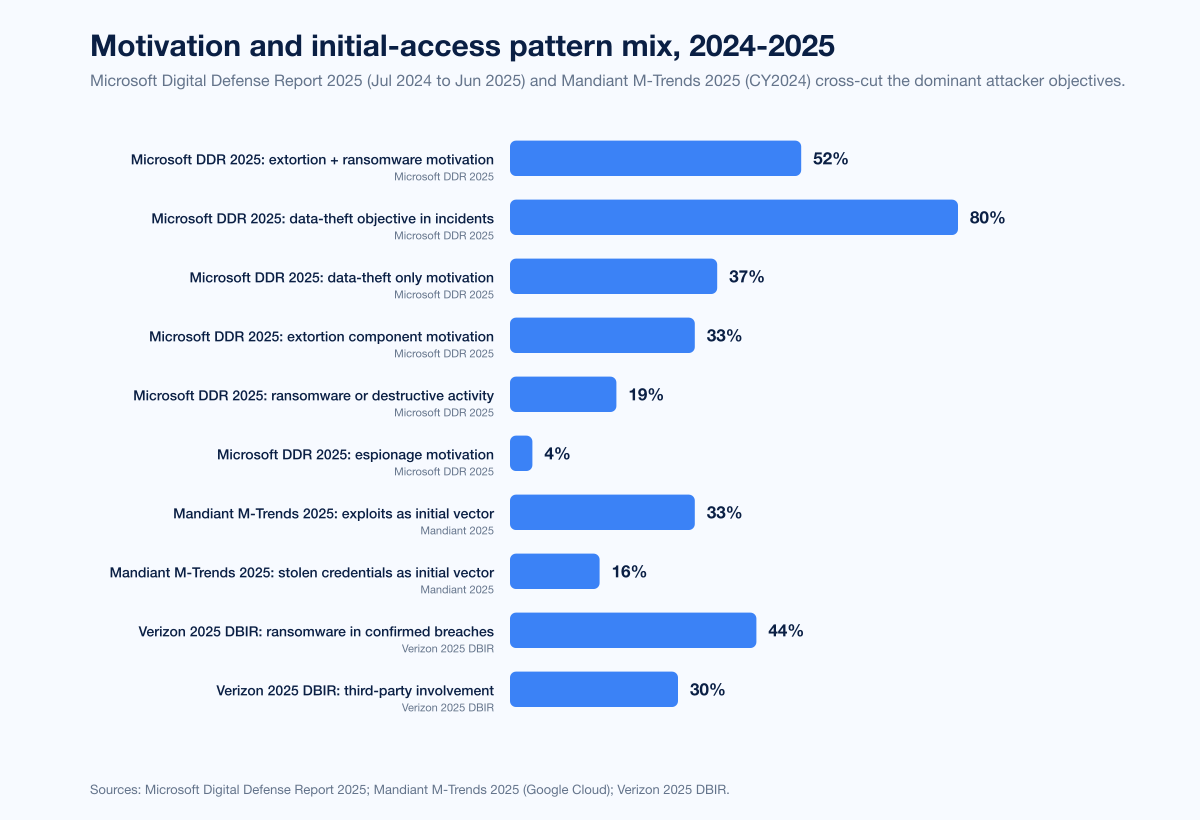
Figure 5: Motivation and pattern mix per Microsoft Digital Defense Report 2025 and Mandiant M-Trends 2025. Microsoft (Jul 2024 to Jun 2025): 52% extortion/ransomware, 4% espionage, 80% data-theft objective, 37% data-theft only, 33% extortion component, 19% ransomware/destructive. Mandiant (CY2024) initial vectors: exploits 33%, stolen credentials 16%. Sources: Microsoft Digital Defense Report 2025; Mandiant M-Trends 2025.
Named 2024-2025 sector incidents
Aggregate stats are useful, but security-budget pitches need named cases.
Change Healthcare (UnitedHealth) ransomware (Healthcare, Feb 2024)
The single largest healthcare data breach in US history. The Russian ransomware group ALPHV/BlackCat encrypted Change Healthcare systems on February 21, 2024 by exploiting stolen credentials against a Citrix portal that lacked MFA. UnitedHealth Group disclosed approximately 192.7 million affected individuals (Jul 31, 2025 update). Ransom paid: approximately US$22 million. Total cost to UnitedHealth: estimated at over US$1.5 billion. The attack disrupted prescription processing, claims, and pharmacy operations across the US healthcare system for weeks.
Snowflake credential breach (Tech / Cross-sector, mid-2024)
Threat actors UNC5537 (also tracked as Scattered Spider and ShinyHunters) accessed customer cloud-data-platform instances using credentials previously stolen by infostealer malware. Mandiant and Snowflake notified approximately 165 customer organizations, including AT&T, Ticketmaster/Live Nation, Santander Bank, LendingTree, Advance Auto Parts, Neiman Marcus, and Bausch Health. Critical issue: customer accounts lacked MFA. The infostealer malware families involved were Lumma, MetaStealer, Raccoon, RedLine, RisePro, and Vidar.
CDK Global ransomware (Auto retail / Tech-services, Jun 2024)
The BlackSuit ransomware group encrypted CDK Global on June 18, 2024, impacting approximately 15,000 car dealerships in the US and Canada. Dealerships processed sales transactions with pen and paper for nearly two weeks. CDK reportedly paid approximately US$25 million in ransom (387 BTC). Estimated dealer losses: over US$1 billion.
PowerSchool data breach (Education, Dec 2024)
PowerSchool's customer support portal compromise exposed approximately 62 million students and 9.5 million teachers. Initial access: phished credentials of a subcontractor in September 2024 with December 2024 escalation, with attackers bypassing MFA via a token-replay vulnerability. PowerSchool paid a ransom and reserved US$28 million for breach-related expenses.
MOVEit follow-on activity (Cross-sector, 2024-2025)
The 2023 Cl0p MOVEit Transfer mass-extortion campaign continued to produce victim disclosures into 2024 and 2025 across financial services, education, healthcare, and government. The Cl0p group was the third-most-active ransomware actor of 2025 per NCC Group's tracking.
What forward outlook do primary sources support?
Projections in this section are labeled and only reflect what primary sources have explicitly stated.
IBM X-Force 2025 projects continued infostealer-driven credential-theft growth, with early 2025 phishing-infostealer volumes already at +180% vs 2023 and +84% vs 2024. Manufacturing's #1 attack-share rank is expected to persist into 2026.
Verizon's 2025 DBIR flagged third-party involvement at 30% of breaches (doubled YoY) and vulnerability exploitation at +34% YoY as the structural trends most likely to continue. Healthcare and Manufacturing espionage motives are projected to remain elevated.
Mandiant M-Trends 2025 projected continued growth in stolen-credential initial access (already 16% of cases for the first time) and edge-device exploitation as an attack surface.
Microsoft DDR 2025 anticipates continued growth in identity-based attacks scaled by generative AI, alongside cloud destructive-campaign growth (+87% YoY) and AI-assisted social engineering.
NCC Group Annual CTI 2025 projected continued ransomware growth into 2026, with Industrials and Consumer Discretionary expected to remain the top two sectors by leak-site activity. Insider-recruitment-as-a-service is flagged as the most novel projected 2026 development.
Forescout Vedere Labs 2025 signaled that OT-protocol attack growth (currently +84% YoY) will continue, with healthcare, manufacturing, government, energy, and financial services as the leading targets.
No primary source known to us as of April 25, 2026 has published a credible full-year 2026 industry-targeting figure; we list no 2026 retrospective stats because none yet exist.
What this means for defenders
Map your sector to the matching threat model. Manufacturing buyers should plan for OT-aware ransomware against the Qilin and Akira playbooks; Healthcare buyers should plan for credential-driven Citrix and VPN compromise plus 12% extortion-only attacks; Financial Services buyers should plan for nation-state pre-positioning plus elevated regulatory-disclosure exposure; Retail should plan for the highest ransom payment rates and the steepest demand curves; Energy and Utilities should plan for living-off-the-land persistence with multi-year dwell.
Take the IBM Cost of a Data Breach industry table as the budgeting floor. Healthcare's US$7.42M, Financial Services' US$5.56M, and Industrial's US$5.00M are not the maximum; they are the average. Plan for at least 3x in tail risk for any single named-incident scenario, especially in Healthcare where Change Healthcare-class events have moved the upper bound past US$1B in total cost.
Prioritize controls by the sector-specific top initial-access vector. Sophos's 32% exploited-vulnerabilities root cause for Manufacturing means patch SLAs and edge-device hardening are the highest-leverage control. The Verizon DBIR's stolen-credentials-at-22% finding for credentials and Mandiant's 16% stolen-credentials initial-access rate mean phishing-resistant MFA, password-manager rollout, and credential-leak monitoring are universally high-leverage.
Prepare for third-party and supply-chain compromise as a near-given. Verizon's third-party involvement doubled to 30%; ITRC's Professional Services growth as a stepping-stone; the Snowflake-class breach pattern. Inventory every authentication boundary your supply-chain partners can reach, audit MFA enforcement on those boundaries, and rehearse the cross-organization incident-response playbook with named partners.
Run sector-targeted offensive testing. A pentest of a manufacturing OT cell is not the same exercise as a pentest of a financial-services SaaS surface. Stingrai's penetration testing engagements build sector-specific scenarios that mirror the 2024-2025 attacker playbook (credential-driven access, vulnerability exploitation, third-party stepping-stone) and run them under controlled conditions. The data above sets the prior for what an attacker is doing on day zero; sector-aware offensive testing tells you which controls actually hold.
Use the cross-sector sources as a portfolio risk lens. No single sector ranking is the complete picture. The combination of IBM X-Force (incidents), Verizon DBIR (confirmed breaches), Mandiant M-Trends (engagements), IBM Cost of a Data Breach (financial impact), Sophos (ransomware survey), NCC Group (leak sites), and Coveware (IR caseload) gives the truest 2026 industry-targeting view. Stingrai's research blog tracks updates as primary publishers issue them.
Frequently Asked Questions
What is the most-targeted industry in 2026?
Manufacturing, by every major industry-targeting ranking. IBM's X-Force Threat Intelligence Index 2025 put Manufacturing at 26% of incidents in 2024, the fourth consecutive year as #1. Verizon's 2025 DBIR recorded 1,607 confirmed Manufacturing breaches, nearly double the prior year. NCC Group's Annual CTI 2025 put Industrials at 28% of leak-site activity. Cisco Talos 2025 and BitSight TRACE both named Manufacturing as the top ransomware target. The structural reasons: low tolerance for downtime, complex IT/OT environments, and supply-chain criticality.
Which industry has the highest data breach cost?
Healthcare, for the 14th consecutive year. IBM's 2025 Cost of a Data Breach Report priced the average healthcare breach at US$7.42M, with a 279-day mean time to identify and contain. Financial Services ranked second at US$5.56M, followed by Industrial at US$5.00M, Energy at US$4.83M, Technology at US$4.79M, and Pharmaceuticals at US$4.61M. The global average across all sectors was US$4.44M (down 9% YoY), but the United States average reached a record US$10.22M.
Which industry has the most confirmed data breaches?
Financial Services took the top spot in the Verizon 2025 DBIR for the first time since 2018, accounting for 27% of major breaches. The ITRC 2025 Annual Data Breach Report confirmed Financial Services as the most-compromised industry with 739 compromises in 2025, ahead of Healthcare (534), Professional Services (478), Manufacturing (299), and Education (188).
Why is Manufacturing the most-attacked sector?
Two structural reasons. First, Manufacturing has the lowest tolerance for downtime in any industry; a paused production line means immediate cash-flow loss, which makes ransom negotiations shorter and increases the likelihood of payment. Second, Manufacturing's IT/OT convergence creates a wider attack surface than any pure-IT sector. Forescout Vedere Labs 2025 reported attacks using OT protocols up 84% YoY in 2025, and Cisco Talos attributed Manufacturing's #1-ransomware-target status directly to "low tolerance for downtime and complex hybrid (IT/OT) environments." The Qilin RaaS operator alone publishes more than 40 manufacturing-victim leak-site posts per month.
What was the largest sector incident of 2024-2025?
By records exposed, the Change Healthcare ransomware attack of February 2024, conducted by ALPHV/BlackCat, affected approximately 192.7 million individuals as of UnitedHealth's July 31, 2025 update, drove the 2024 healthcare-records-affected figure to a record 289,162,330, and cost UnitedHealth an estimated US$1.5 billion. By cross-sector blast radius, the Snowflake breach of mid-2024 compromised approximately 165 customer organizations including AT&T, Ticketmaster, Santander, LendingTree, and Neiman Marcus. By single-incident operational disruption, the CDK Global ransomware attack hit 15,000 auto dealerships and produced US$1B+ in estimated dealer losses.
What does Microsoft say about industry targeting?
Microsoft's Digital Defense Report 2025 reports that more than 52% of cyberattacks with known motivations are driven by extortion and ransomware, while espionage accounts for just 4%. In 80% of incidents, attackers aimed to steal data. Government, education, IT, research and academia, and think tanks/NGOs are flagged as the top espionage targets because they manage sensitive data and operate on legacy systems with limited IR capabilities. Microsoft processes over 100 trillion daily signals, blocks 4.5 million new malware attempts daily, analyzes 38 million identity risk detections daily, and scans 5 billion emails daily.
How is ransomware distributed across sectors?
Three primary publishers give three different but compatible answers. NCC Group 2025 (leak-site activity, 7,874 attacks): Industrials 28%, Consumer Discretionary 22%, IT 10%. Coveware Q2 2025 (incident-response caseload): Professional Services 19.7%, Consumer Services 13.7%, Healthcare 13.7%, Public Sector 9.4%, Financial Services 7.7%. Cisco Talos 2025: Manufacturing #1 ransomware target, Higher Education #1 device-compromise target. The combination of leak-site, IR caseload, and per-vendor telemetry shows that Industrials/Manufacturing leads visible ransomware events while Professional Services has emerged as the top IR caseload sector in 2025.
What sectors are nation-states targeting?
Microsoft DDR 2025 identifies IT, government, research and academia, and think tanks/NGOs as the priority espionage targets. CrowdStrike's 2025 Global Threat Report reported a 150% YoY rise in China-nexus state activity overall and up to a 300% rise in targeted attacks on financial services, media, manufacturing, and industrials. Verizon's 2025 DBIR flagged Healthcare's espionage motive jumping from 1% to 16% of breaches and Manufacturing's from 3% to 20%. Volt Typhoon and its successor Voltzite have continued to embed in US electric, oil, and gas networks through 2025.
How do regional rankings differ?
IBM X-Force 2025 lists Asia-Pacific at 34% of attacks (most-targeted region), North America at 24%, Europe third, and Middle East at 10% (up from 7% in 2023). Inside Europe, ENISA's Threat Landscape 2025 reports a different picture because of hacktivism-driven low-impact DDoS: Public Administration 38.2%, Transport 7.5%, Digital Infrastructure 4.8%, Finance 4.5%, Manufacturing 2.9%. The transatlantic difference is largely a hacktivism artifact; outside Europe, financially-motivated criminal activity dominates and Manufacturing and Finance rise to the top.
How can organizations defend against sector-specific attacks?
Six controls that the data supports. First, deploy phishing-resistant MFA on every account that supports it; Microsoft's 99% blocking rate proves the case. Second, harden patch SLAs and edge-device exposure; Sophos's 32% exploited-vulnerabilities root cause for Manufacturing and the 30% retail figure show this is the highest-leverage control for the most-attacked industries. Third, build third-party-risk visibility into incident response, since Verizon's third-party involvement doubled to 30%. Fourth, run sector-aware offensive testing; an OT cell pentest is not a SaaS pentest. Fifth, invalidate session cookies and rotate tokens whenever an infostealer hit is detected; Microsoft and Mandiant agree credentials are now the second-most-common initial vector. Sixth, rehearse the full attacker playbook in Stingrai's red team and penetration testing engagements so credential abuse, vulnerability exploitation, third-party stepping-stones, and AiTM resistance are exercised under controlled conditions.
Where can I get the latest industry-targeting data?
The primary publishers to track are IBM X-Force (annual Threat Intelligence Index, April), Verizon (annual DBIR, May), IBM (Cost of a Data Breach annual, August), Mandiant / Google Cloud (M-Trends annual, April), Microsoft (Digital Defense Report annual, October), Sophos (State of Ransomware annual, June; sector sub-reports through the year), NCC Group (Annual Cyber Threat Intelligence, January, and monthly threat pulses), Coveware / Veeam (quarterly marketplace reports), Cisco Talos (Year in Review annual, April), ENISA (Threat Landscape annual, October), CrowdStrike (Global Threat Report annual, February), ITRC (Annual Data Breach Report, January), HHS OCR Breach Portal (continuous), HIPAA Journal (monthly and annual healthcare analyses), FBI IC3 (Annual Internet Crime Report, April), BitSight TRACE (State of the Underground), Forescout Vedere Labs (Threat Roundup annual, January). Stingrai's research blog tracks updates as primary publishers issue them.
References
IBM. X-Force Threat Intelligence Index 2025. April 2025. https://www.ibm.com/think/x-force/x-force-threat-intelligence-index-2025-attackers-steal-sell-user-identities. Annual incident-response and threat-intelligence telemetry analysis; CY2024 data; Manufacturing 26% (#1 for 4th consecutive year); regional split APAC 34%, North America 24%, Middle East 10%.
Verizon. 2025 Data Breach Investigations Report. May 2025. https://www.verizon.com/business/resources/Tea/reports/2025-dbir-data-breach-investigations-report.pdf. 22,052 incidents and 12,195 confirmed breaches between Nov 1 2023 and Oct 31 2024; Financial Services 27% of major breaches; Manufacturing 1,607 confirmed breaches.
IBM. 2025 Cost of a Data Breach Report. August 2025. https://www.ibm.com/reports/data-breach. Annual breach economics study; Healthcare US$7.42M (#1 for 14 years; 279-day containment); Financial Services US$5.56M; global average US$4.44M.
Mandiant (Google Cloud). M-Trends 2025. April 2025. https://cloud.google.com/blog/topics/threat-intelligence/m-trends-2025. 450,000+ hours of consulting investigations Jan 1 2024 to Dec 31 2024; Financial Services 17.4% (top); Business and Professional Services 11.1%; High Tech 10.6%; Government 9.5%; Healthcare 9.3%.
Microsoft. Digital Defense Report 2025. October 2025. https://www.microsoft.com/en-us/corporate-responsibility/cybersecurity/microsoft-digital-defense-report-2025/. Coverage Jul 2024 to Jun 2025; 100T+ daily signals; 52% extortion/ransomware vs 4% espionage; 80% data theft objective.
Microsoft (EMEA news). Microsoft Digital Defense Report 2025: Cybersecurity Trends and Threats. October 2025. https://news.microsoft.com/source/emea/features/microsoft-digital-defense-report-2025-extortion-and-ransomware-drive-over-half-of-cyberattacks/. Government and education institutions targeting framing.
Sophos. State of Ransomware 2025. June 2025. https://www.sophos.com/en-us/blog/the-state-of-ransomware-2025. n=3,400 IT and cybersecurity leaders across 17 countries; US$1.0M average payment; US$1.5M recovery cost; 32% root-cause exploited vulnerabilities.
Sophos. State of Ransomware in Manufacturing and Production 2025. December 2025. https://news.sophos.com/en-us/2025/12/03/the-state-of-ransomware-in-manufacturing-and-production-2025/. 32% root cause exploited vulnerabilities; 40% encryption rate (5-year low); 39% data theft + encryption.
Sophos. State of Ransomware in Retail 2025. 2025. https://www.sophos.com/en-us/blog/the-state-of-ransomware-in-retail-2025. 58% ransom payment rate (highest of any sector); US$2M median demand; 27% of demands above US$5M.
Sophos. State of Ransomware in Healthcare 2025. October 2025. https://news.sophos.com/en-us/2025/10/08/the-state-of-ransomware-in-healthcare-2025/. n=292 healthcare providers; 34% encryption rate (5-year low); US$343K median demand (-91% YoY); US$150K median payment.
NCC Group. Annual Cyber Threat Intelligence 2025. January 2026. https://www.nccgroup.com/newsroom/ncc-group-annual-cyber-threat-intelligence-2025/. 7,874 ransomware attacks (+50% YoY); Industrials 28% (2,190 attacks); Consumer Discretionary 22% (1,774); Qilin top actor with 1,022 attacks.
NCC Group. Monthly Threat Pulse: December 2025. January 2026. https://www.nccgroup.com/newsroom/ncc-group-monthly-threat-pulse-review-of-december-2025/. 784 incidents in December 2025; Industrials 29%; Consumer Discretionary 22%; IT 10%.
Coveware (Veeam). Q2 2025 Ransomware Marketplace Report. July 2025. https://www.coveware.com/blog/2025/7/21/targeted-social-engineering-is-en-vogue-as-ransom-payment-sizes-increase. Professional Services 19.7%; Consumer Services 13.7%; Healthcare 13.7%; Public Sector 9.4%; Financial Services 7.7%; US$1,130,070 average ransom payment.
Cisco Talos. 2025 Year in Review. April 2026. https://blog.talosintelligence.com/2025yearinreview/. Manufacturing #1 ransomware target; Higher Education #1 device-compromise target; Qilin 40+ leak-site posts/month; vishing 3x higher against IT admins than users.
ENISA. Threat Landscape 2025. October 2025. https://www.enisa.europa.eu/sites/default/files/2025-11/ENISA%20Threat%20Landscape%202025.pdf. 4,875 incidents Jul 1 2024 to Jun 30 2025; Public Administration 38.2%; Transport 7.5%; 94.8% of Public Administration incidents are DDoS.
CrowdStrike. 2025 Global Threat Report. February 2025. https://fusion.vsp.virginia.gov/wp-content/uploads/2025/07/CrowdStrikeGlobalThreatReport2025.pdf. Technology #1-targeted sector for 7th consecutive year; China-nexus state activity +150%; up to +300% targeting of finance, media, manufacturing, industrials; 79% malware-free attacks.
Identity Theft Resource Center. 2025 Annual Data Breach Report. January 2026. https://www.idtheftcenter.org/post/2025-annual-data-breach-report-record-number-compromises/. 3,322 compromises (+5% YoY); Financial Services 739; Healthcare 534; Professional Services 478 (largest growth); Manufacturing 299; Education 188.
HHS OCR. Breach Portal. Continuous. https://ocrportal.hhs.gov/ocr/breach/breach_report.jsf. Tracks healthcare breaches affecting 500+ records; 725 to 742 breaches in 2024; 642 in 2025; 289,162,330 individuals in 2024; 61,556,256 in 2025.
HIPAA Journal. 2025 Healthcare Data Breach Report. January 2026. https://www.hipaajournal.com/2025-healthcare-data-breach-report/. Aggregates HHS OCR data; 13.5% YoY decline in large breaches; 78.7% YoY decline in individuals affected.
HIPAA Journal. Verizon 2025 DBIR analysis. May 2025. https://www.hipaajournal.com/verizon-dbir-2025/. Healthcare 1,702 incidents and 1,542 confirmed breaches; espionage-motive jump from 1% to 16%.
FBI Internet Crime Complaint Center. 2024 Internet Crime Report. April 2025. https://www.ic3.gov/AnnualReport/Reports/2024_IC3Report.pdf. 859,532 complaints; US$16.6B losses (+33% YoY); 4,800+ critical-infrastructure complaints; 3,156 ransomware complaints (+9% YoY).
BitSight. CVE Trends by Industry Sector and 2025 State of the Underground. 2025. https://www.bitsight.com/blog/cve-trends-by-sector. Manufacturing most-targeted industry for 3rd consecutive year; Information sector and Professional/Scientific/Technical Services highly affected.
Forescout Vedere Labs. 2025 Threat Roundup Report. January 2026. https://finance.yahoo.com/news/forescout-2025-threat-roundup-report-130000557.html. 900M+ attacks reviewed Jan-Dec 2025; OT-protocol attacks +84% YoY; healthcare, manufacturing, government, energy, financial services as leading targets.
Forescout Vedere Labs. Solar Power Vulnerability Disclosure. March 2025. https://www.businesswire.com/news/home/20250327043178/en/Forescout-Vedere-Labs-Uncovers-Severe-Systemic-Security-Risks-in-Global-Solar-Power-Infrastructure. 46 new vulnerabilities across 3 of 10 leading solar inverter vendors; 80% of solar power vulnerabilities high or critical severity.
Comparitech. Education Ransomware Roundup 2025. 2026. https://www.comparitech.com/news/education-ransomware-roundup-2025-stats-on-attacks-ransoms-and-data-breaches/. 251 education ransomware attacks (94 confirmed); 3.96M records affected; US$464K average ransom demand (-33% YoY); 130 US attacks (-9% YoY).
K12 SIX (via K-12 Dive). Annual K-12 Cybersecurity Report. 2025. https://www.k12dive.com/news/education-ransomware-attacks-2024-comparitech/736854/. 90+ US school districts hit by ransomware in 2024 affecting 1,600+ schools; 83 disclosed K-12 ransomware attacks Jan 2023 to Jun 2024.
CIS MS-ISAC. 2025 K-12 State of Cybersecurity Report. 2025. https://www.cisecurity.org/insights/white-papers/2025-k12-cybersecurity-report. 5,000+ K-12 organizations Jul 2023 to Dec 2024; 82% experienced cyber threat impact; 14,000 security events; 9,300 confirmed cybersecurity incidents.
PowerSchool. SIS Incident Notice of US Data Breach. 2025. https://www.powerschool.com/security/sis-incident/notice-of-united-states-data-breach/. 62M students and 9.5M teachers affected; subcontractor credential phishing; MFA bypass via token replay; US$28M reserve.
Cloud Security Alliance. Unpacking the 2024 Snowflake Data Breach. May 2025. https://cloudsecurityalliance.org/blog/2025/05/07/unpacking-the-2024-snowflake-data-breach. 165+ customer organizations affected; AT&T, Ticketmaster, Santander, LendingTree; infostealer-stolen credentials; missing MFA.
The Hacker News (covering Mandiant + Snowflake). Snowflake Breach Exposes 165 Customers' Data. June 2024. https://thehackernews.com/2024/06/snowflake-breach-exposes-165-customers.html. UNC5537 / Scattered Spider / ShinyHunters; Lumma, MetaStealer, Raccoon, RedLine, RisePro, Vidar.
CNN Business. CDK Global ransom payment. July 2024. https://edition.cnn.com/2024/07/11/business/cdk-hack-ransom-tweny-five-million-dollars. BlackSuit ransomware on June 18 2024; 15,000 dealerships; ~US$25M (387 BTC) ransom paid; ~2-week recovery.
Kaspersky. The complete story of the 2024 ransomware attack on UnitedHealth. 2025. https://www.kaspersky.com/blog/unitedhealth-ransomware-attack/53065/. ALPHV/BlackCat group; Citrix portal stolen credentials; missing MFA; ~US$22M ransom paid; estimated US$1.5B+ total cost.
The Record. Researchers warn Volt Typhoon still embedded in US utilities. 2026. https://therecord.media/researchers-warn-volt-typhoon-still-active-critical-infrastructure. Continued China-nexus persistence in US electric, oil, gas; Voltzite cluster.
Trustwave / LevelBlue. 2025 SpiderLabs Energy and Utilities Cybersecurity Challenges. 2025. https://levelblue.com/resources/research-reports/spiderlabs-research-cybersecurity-challenges-for-energy-and-utilities-in-2025/. +80% YoY ransomware in energy and utilities sector.
Cyfirma (via Industrial Cyber). Energy and Utilities Cyber Threats Escalate. 2025. https://industrialcyber.co/utilities-energy-power-water-waste/energy-and-utilities-cyber-threats-escalate-as-ransomware-and-apt-activity-rise-cyfirma-reports/. 72 energy ransomware victims (+64% over prior period).
CyberScoop. Ransomware attacks hitting energy, oil, gas hard. 2025. https://cyberscoop.com/ransomware-energy-oil-gas-report/. >50% of energy/oil/gas/utilities ransomware victims taking >1 month to recover; up from 19% in 2022.
This is the Stingrai research team's 2026 industry-targeting reference. Stingrai, founded in 2021, is an offensive security firm running penetration testing, red team, and social engineering engagements for global customers across manufacturing, healthcare, finance, technology, and critical infrastructure. If you want to see how your sector's attack surface stands up to the named playbooks documented above, our services page lists what we run and how to start a scoping call.